Hurricane EMA
- インディケータ
- Mohammad Abbas Mohammad Dashti
- バージョン: 1.0
EMA Slope Angle Tracker: Stop Guessing Momentum
Most traders use Moving Averages to identify the trend, but they miss the most crucial piece of data: Momentum. Eyeballing the curve of an EMA can be incredibly deceptive. Is the trend actually accelerating, or is it just slowly bleeding out?
The Hurricane EMA takes the guesswork out of trend-following by calculating the exact mathematical trajectory of the market to give you an objective, geometric read-on market momentum.
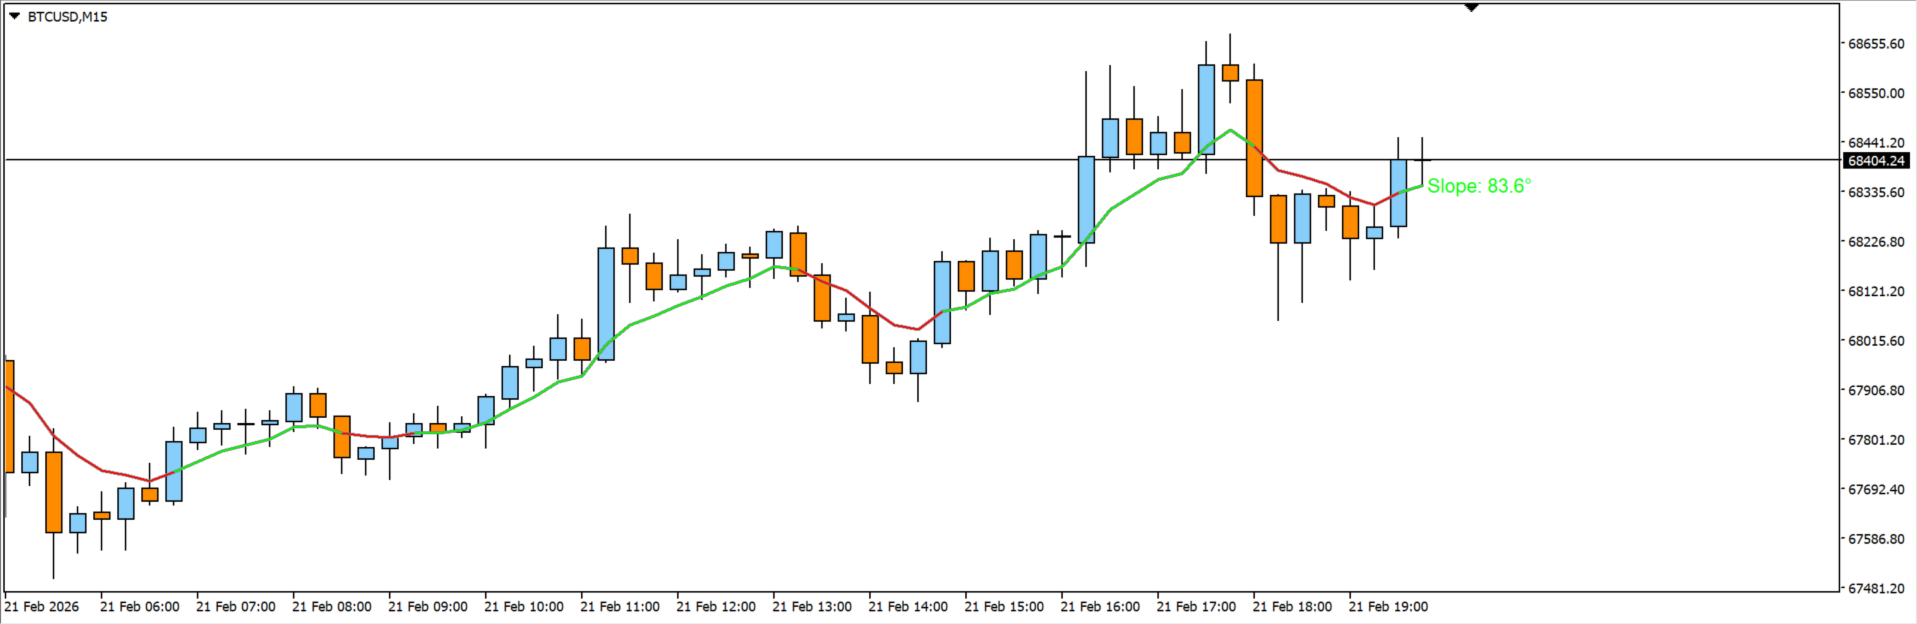
Instead of just plotting a standard line, this indicator calculates the true degree angle of the EMA's slope and visually alerts you when the market is gaining aggressive momentum or dying off into a flat range.
Key Features:
-
Dynamic Color-Coding: The EMA line seamlessly changes color in real-time. It glows Lime when the angle blasts upward, Red when it crashes downward, and Gray when the market is flat and chopping.
-
Live Angle Display: A floating text label attaches directly to the current price, showing you the exact, live mathematical degree of the slope (e.g., Slope: 45.2°).
-
Chop-Zone Filter: You control the "Flat Threshold." If you set the threshold to 15°, the indicator will paint the line gray and keep you out of the market anytime the slope drops below a 15-degree angle.
-
Fully Customizable: Works on any timeframe and any asset. You can adjust the EMA length, the lookback period for the angle math, and the strictness of the degree thresholds to fit your exact trading style.
How to Use It: Stop trading in the "Gray Zones." Use the EMA Slope Angle Tracker as a primary momentum filter. Only execute long setups when the angle is steep and green, and only execute shorts when the angle is steep and red. When the angle goes flat, you sit on your hands and protect your capital.