The Pulse mt4
- インディケータ
- バージョン: 1.6
- アップデート済み: 24 2月 2026
- アクティベーション: 10

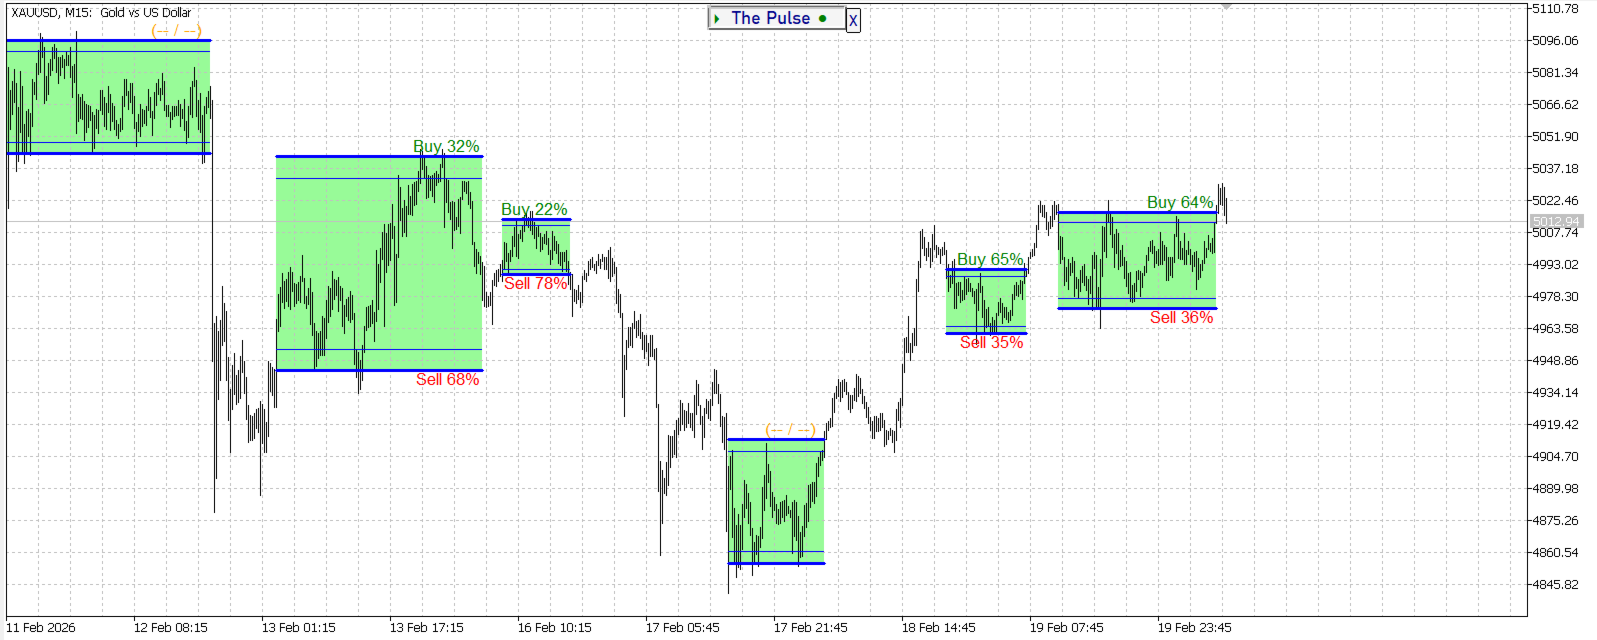
The Pulse は、蓄積期間をリアルタイムで示す指標である。
簡単に言えば、蓄積とは、「スマートマネー」が市場で強力な動きを起こす前に静かに資産を集めることです。
チャート上では、価格が1つの範囲で「立ち往生」しているように見えます。 これは蓄積段階です-誰かが大きな動きの準備をしています。
そして、市場が"凍結"しているように見えるが、同時に緊張が感じられるときに、これらの瞬間に気づくことを学ぶなら、適切なタイミングで適切な場
さらに、The Pulse インジケータは、各蓄積に対して計算を実行し、蓄積期間後の可能な価格ポテンシャルの方向を決定することができる。
The Pulse インジケータの助けを借りて、市場構造をよりよく見て理解することができます。
The Pulse Blog.
Version mt5
蓄積期間を決定することは、適切な瞬間を待つことができることを意味します。
インジケータ The Pulse は蓄積期間を示し、価格は蓄積において望むように動くことができるが、ほとんどの場合、動きは横方向である。
累積期間はさまざまな方法で使用できます:
- 蓄積期間中は、市場の外に滞在し、蓄積されたエネルギーを解放し、移動を開始する価格を待つことができます。
- 適切なスキルと経験を持つ、あなたは蓄積内で取引することができます。
- 長期的な価格やトレンドの動きの後に蓄積が現れる場合は、以前に開かれた取引を確認する方が良いかもしれません。 たとえば、利益を修正したり、損益分岐点に設定したりします。
The Pulse:
- 自動的に蓄積の期間を検出します
- 色と信号でチャート上のゾーンを強調表示します-シンプルで理解できます。
-
蓄積後の電位を計算します。
- インジケータは再描画されません。
- 任意のペアと時間枠で動作します。
- 複雑な設定はありません。
これは取引にどのように役立ちますか? 具体的には:
- 早めのエントリー。 あなたは主な動きの開始前に市場に参入します—より多くの利益、より少ないリスク。
- 負けトレードが少なくなります。 あなたは偽の吹き出物やノイズをキャッチしません。
- 自信を持っています。 あなたは市場の構造を見るでしょう。
- 規律。 あなたは退屈から取引するのではなく、待つことを学びます。
The Pulse の蓄積の表示器は市場のあなたの内部コンパスである。
蓄積を認識することを学び、あなたは市場の乗客であることをやめるでしょう。 あなたはオブザーバーになります。 理解している。 自信を持って。
あなたは何があるのかだけでなく、すぐに何があるのかもわかります。
それは魔法ではありません。 これは市場読み取り技術です。


an easy tool to see accumulations and with it button it is easy to use an real plus in trading well done warmly