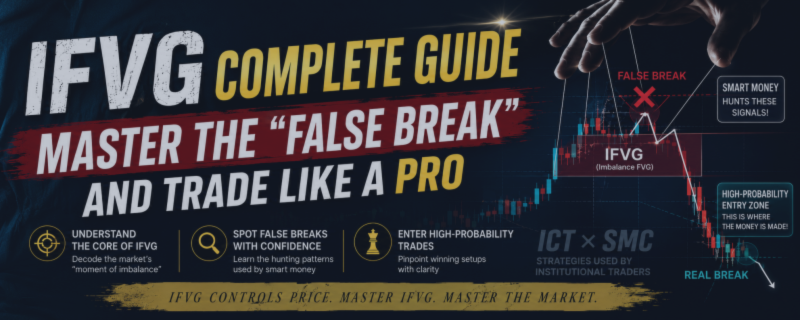
Mastering IFVG ── The One Signal That Exposes a Fake Breakout
2 7月 2026, 13:17
## Introduction ── Was That Really a Breakout?

Have you ever watched price break a high or a low, only to get wicked straight back through and reverse?
That "fake breakout" actually leaves a very clear footprint on the chart.
It's called the **IFVG (Inverted Fair Value Gap)**, and that's what this article is about.

---
## 1. What Is an IFVG?
First, a quick refresher on the FVG (Fair Value Gap).
Out of three consecutive candles, a "gap" forms between the high (or low) of the first candle and the low (or high) of the third. It's the footprint left behind when big players rush an order through the market.
**An IFVG is what happens when that FVG gets broken through with a full-bodied candle in the opposite direction, and confirmed.**
For example, a bearish FVG that formed during a downtrend gets decisively broken to the upside with a closed candle body.
What does that tell you?
That price region was originally meant to be "space that fuels the continuation of the drop." The fact that it just got broken upward means:

**Smart money no longer intends to push price in that direction.**
In other words, it's evidence that sentiment has flipped to bullish in an instant.
The setup gets especially strong when **an IFVG forms right after a liquidity sweep** (a temporary breach of a high or low). Because it triggers retail stop-losses first, then flips direction, it tends to be a high-precision reversal signal.
---
## 2. How to Actually Use It ── 3 Practical Patterns
An IFVG is far more reliable when you know *which context* it appeared in. Here are three patterns worth knowing.
### Pattern 1: AMD + IFVG
Price often moves through a cycle: "Accumulation → Manipulation → Distribution."
1. Price ranges and builds up orders (Accumulation)
2. Price briefly breaks one edge of the range, sweeping retail stop-losses (Manipulation)
3. Price then reverses hard toward its real target (Distribution)
The IFVG that appears right after this Manipulation phase — right as Distribution begins — is one of the clearest entry triggers within the AMD cycle.
If you see price get swept down briefly, then suddenly confirm an FVG to the upside, that's a strong signal that Manipulation has ended and Distribution has begun.
### Pattern 2: Reversal IFVG After a Break of Session or Daily Highs/Lows
The London session high. The New York session low. Or the daily high/low.
If price breaks one of these key levels but forms *no* FVG in the direction of the break, that's a "displacement-less breakout" — likely a fake move.
If price then returns inside the level and forms an IFVG in the opposite direction, treat that as a reversal signal targeting "the level that should have broken instead."
The more widely watched the level — session highs/lows, daily highs/lows — the stronger the reaction tends to be when this plays out.
### Pattern 3: Reversal IFVG at an Existing FVG or Order Block
When price returns to an existing FVG or Order Block (OB) zone, it sometimes forms a small FVG in the opposite direction first — which then gets inverted almost immediately.
This is the footprint of smart money luring retail the wrong way for a moment before resuming the real direction, right inside a zone it's clearly defending.
When this reaction happens at a higher-timeframe key level (an FVG or OB) that price has just tapped, it's a stronger, more stacked reversal signal than a standalone IFVG.
---
## 3. The Real Problem: Checking Every Pair and Timeframe Is Simply Not Realistic
If you've read this far, you might be thinking:
"I get the concept. But checking this across every pair and multiple timeframes, every single day? That's not realistic."
You'd be right.
Honestly, manually monitoring 64 pairs across 7 timeframes is close to impossible — even for a full-time trader.
So I built a tool to automate exactly that: scanning all pairs and timeframes for IFVGs.
**It scans 64 currency pairs × 7 timeframes — 448 charts in total — in one pass, and lists every IFVG the moment it forms. Click a result and the chart opens instantly.**

The IFVG scanner introduced here was built specifically to catch, in real time, the exact signal this article just walked through.