Platform: MetaTrader 4 | Price: 35 USD | Product page: mql5.com/ja/market/product/181837
Overview
A Fair Value Gap (FVG) is the price gap left between candle 1's high and candle 3's low in a 3-candle sequence. When price closes a candle body completely through that FVG in the opposite direction, the gap becomes an Inverse Fair Value Gap (IFVG). Traders who study ICT concepts know how significant this "invalidated FVG" can be.
The problem is that manually tracking when and where this happens — across which symbol, on which timeframe — isn't realistic. IFVG All Currency Scanner 448 Dashboard monitors up to 448 combinations (symbols × timeframes) on one screen and flags each confirmed-candle IFVG with color.
What is an IFVG

An FVG is the gap between candle 1's high and candle 3's low in a 3-candle sequence. When price closes a candle body completely through that FVG in the opposite direction, the same gap becomes an IFVG. A wick poking through without a body close does not count.
Real Trade Examples
Examples of how IFVG plays out within ICT's AMD model: Accumulation → Manipulation → Distribution.


▶ View Product Page (MQL5, 35 USD)
What Changes When You Can Watch More Symbols
Monitoring more symbols means more chances to encounter a setup where all your conditions line up. With a larger pool of opportunities, you don't need to force an entry on the first thing you see — you can compare several candidates and choose. The practical result is that it becomes easier to be selective about which setups you take.
Because up to 448 combinations are consolidated on a single screen, you no longer need to keep multiple charts open just to keep an eye on things. There's only one screen to check. Clicking a timeframe label opens that exact symbol/timeframe chart instantly — no hunting around after you spot something on the dashboard.
What's Inside ─ Reading the Dashboard by Color
Each cell represents one symbol × one timeframe.

| Color | Meaning |
|---|---|
| YELLOW | Monitored OFF |
| CYAN | Timeframe currently in an uptrend condition |
| RED | Timeframe currently in a downtrend condition |
| PINK | Downtrend alert just triggered |
| BLUE | Uptrend alert just triggered |
| Symbol name in red | An alert is currently active for this symbol |
Click any timeframe label to open that exact symbol/timeframe chart instantly.
Example Sign on Chart

When an IFVG is detected, an arrow marker appears on the chart. Once you notice an alert on the dashboard, you can open the chart and confirm the actual price action like this.
Feature Summary
- Monitors up to 448 combinations (symbols × timeframes) at once. Layout is flexible (e.g. 56 symbols × 8 timeframes, 64 symbols × 7 timeframes)
- Detects the core ICT concept IFVG, using confirmed candles only (the currently forming candle is never used)
- Non-repainting
- Works with any symbol shown in MT4's Market Watch — forex, gold, and more
- Click any timeframe label to instantly open that exact symbol/timeframe chart
- Spread filter excludes symbols with temporarily wide spreads
- Email and mobile push notifications supported
- Display position, font size, line spacing and column spacing are all customizable
How It Works
The starting point is the FVG — the gap between candle 1's high and candle 3's low in a 3-candle sequence. When price closes a candle body completely through that FVG in the opposite direction, the gap is confirmed as an IFVG (a wick-only break does not count). All detection uses confirmed candles only; the currently forming candle is never used.
Input Parameters
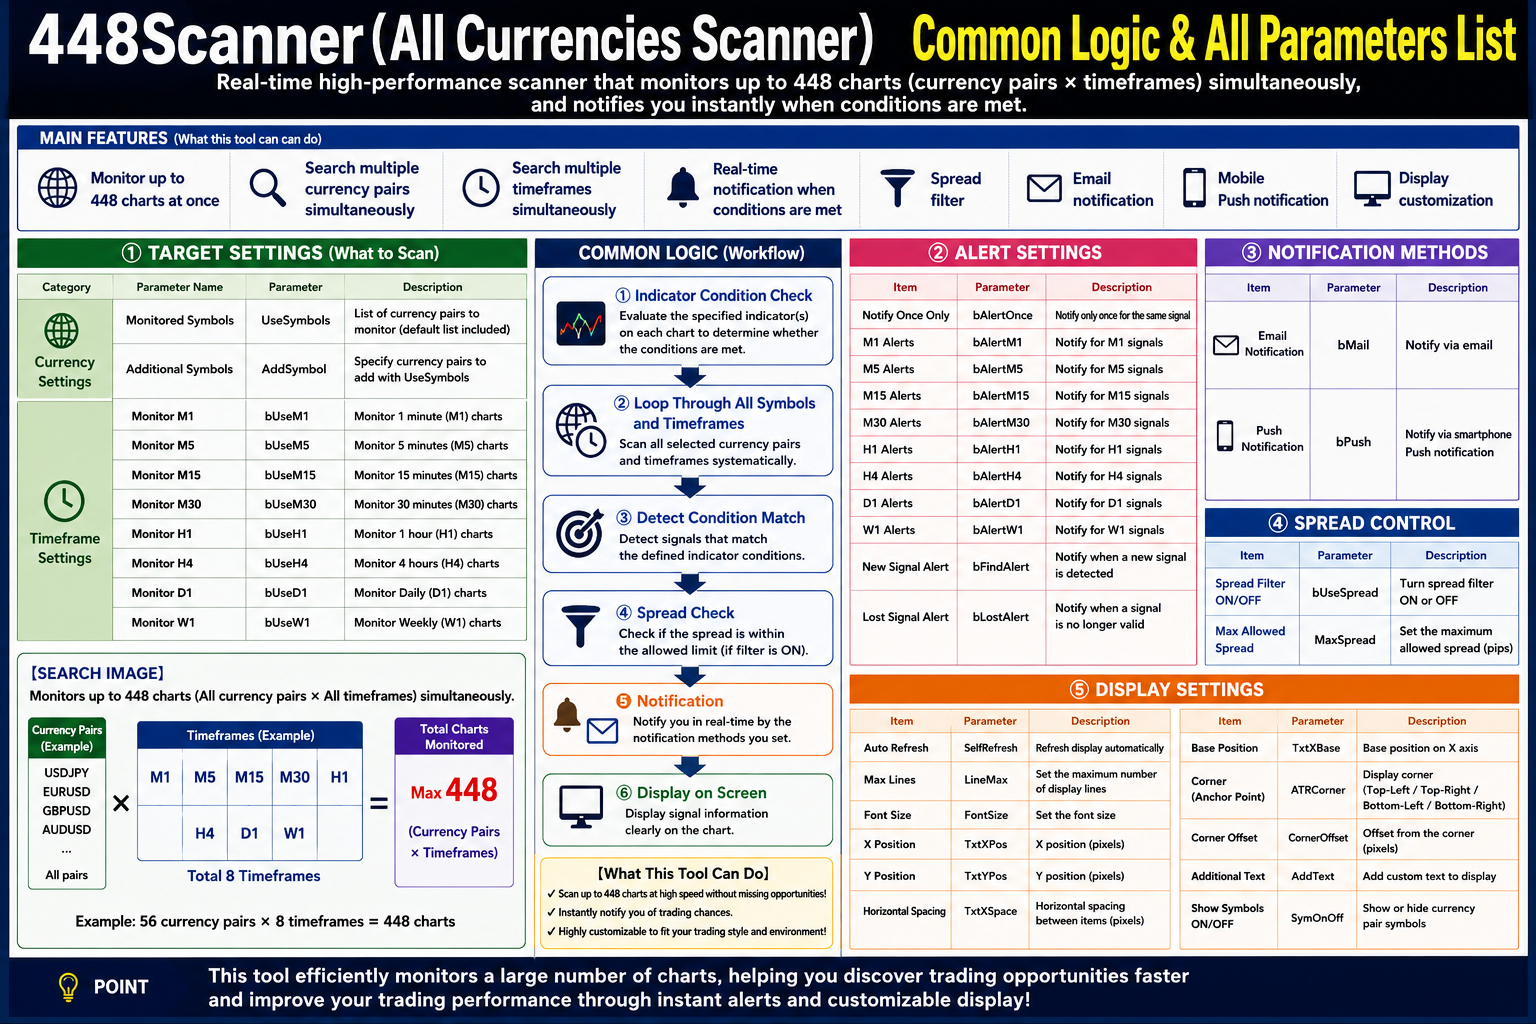
| Category | Parameter | Description |
|---|---|---|
| Target Settings | UseSymbols | List of currency pairs to scan (not set by default) |
| AddSymbol | Additional currency pairs to add alongside UseSymbols | |
| Timeframe Settings | bUseM1 〜 bUseW1 | Whether each of M1/M5/M15/M30/H1/H4/D1/W1 is included in the scan |
| Alert Settings | bAlertOnce / bAlertM1〜bAlertW1 | Suppress duplicate notification for the same signal / per-timeframe alert on-off |
| bFindAlert / bLostAlert | Notify on new signal detected / signal no longer valid | |
| Notification | bMail / bPush | Email notification / mobile push notification |
| Spread Control | bUseSpread / MaxSpread | Spread filter on/off and the maximum allowed spread (pips) |
| Display Settings | SelfRefresh / ATRCorner / LineMax / FontSize | Auto refresh / display corner / max display lines / font size |
| TxtXPos / TxtYPos / TxtXSpace / AddText / SymOnOff | Display coordinates / item spacing / custom text / show-hide symbol names |
About the "448" Number
448 is the reference figure for a baseline layout (e.g. 64 symbols × 7 timeframes, or 56 symbols × 8 timeframes). The real limit is only the available drawing space — by adjusting font size and the number of display lines, you can extend monitoring to roughly 100 symbols.
Specifying Symbols
- By currency code: entering "EUR USD JPY" auto-generates EURUSD, EURJPY, USDJPY
- By symbol name: entering "XAUUSD" adds gold directly
- Mixed: "XAUUSD USD EUR JPY" scans gold plus the currency-pair combinations
Only symbols currently shown in MT4's Market Watch are eligible for scanning.
Trading Workflow

- Focus on IFVG: when an alert fires on the dashboard, click the pair to open its chart
- Check where price was swept: on the chart, locate where the recent high/low was swept and use the key levels to identify the best entry location
- Then wait for the result: follow your own rules and wait for the outcome
Layout Variations

The timeframe layout (how many/which timeframes are displayed) can be adjusted to fit your use case. As shown above, you can run a shorter-timeframe layout, a layout with added rating values, and other variations.
Coverage
| Item | Detail |
|---|---|
| Example baseline layouts | 64 symbols × 7 timeframes, or 56 symbols × 8 timeframes = 448 combinations |
| Extended layout | Up to roughly 100 symbols with display adjustments (drawing space is the only constraint) |
| Supported symbols | Any symbol shown in MT4's Market Watch — forex, gold, etc. |
| Platform | MetaTrader 4 |
Who This Is For
- Traders who use the IFVG concept but suspect they're missing setups
- Anyone who can't stay glued to charts all day
- Traders who want to act only on justified setups rather than gut feel
Usage Notes
- Every sign is judged on confirmed candles only (the current candle is never used)
- When a sign appears, always open the target chart and do your own analysis
- Turning off timeframes you don't need makes the tool run lighter
- If running multiple instances, set a different value in AddText for each
About the Author
20 years of discretionary forex trading experience. Built around ICT / Smart Money Concepts market-structure analysis, the author has spent 10 years developing and running an independent tool suite (the All-Currency Search Lab) that scans across all symbols and all timeframes.