
Start with a single symbol ─ an ICT IFVG sign indicator
Overview
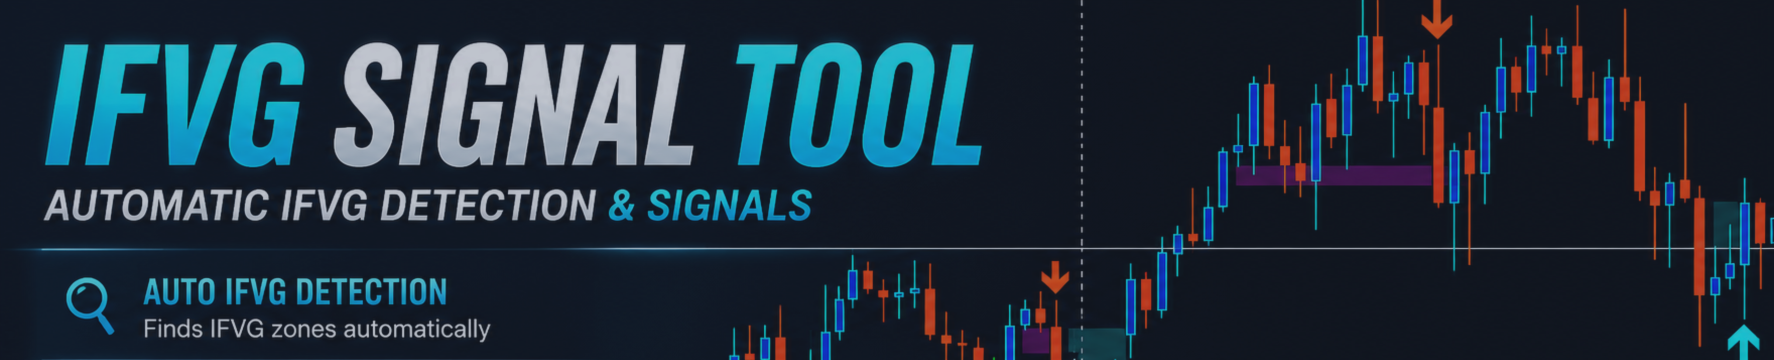
An IFVG (Inverse Fair Value Gap) appears when an FVG is completely invalidated by candle body, marking a scene where smart money commits to its real direction. IFVG Signals is a simple indicator that automatically marks this moment on your chart with arrow signs.
Start with just one symbol, one chart, and see for yourself how IFVG actually shows up.

What It Does
- Marks IFVG (buy/sell) on the chart with arrows (buy = cyan upward arrow, sell = orange-red downward arrow)
- Highlights the price zone where the IFVG formed as a colored rectangle (toggle on/off)
- Alert, push notification, and email notification on confirmed signs (each toggle on/off)
- Minimum gap-size filter (ATR-based, or a fixed pip value) to cut out noise
- Optional MA filter to only show signs aligned with the larger trend direction
- Confirmed-bar judgment only ─ no repaint
How It Works

The indicator detects the GAP (FVG) that forms between the high of the 1st candle and the low of the 3rd candle in a 3-candle sequence. Once a later candle closes completely through this GAP in the opposite direction, it confirms as an IFVG sign. If the gap is too small relative to ATR, it is filtered out as noise (by default, roughly 20% of ATR for wide-range symbols like Gold, and 10% of ATR for others).
Main Settings
| Parameter | Default | Description |
|---|---|---|
| bAlert | true | Show an alert when a sign is confirmed |
| IFVG_GapBars | 15 | Max number of bars to search for IFVG formation after an FVG appears |
| bUseMAFilter | false | Toggle the MA filter |
| ShowZones | true | Toggle the IFVG zone (rectangle) display |
| MA_Period / MA_Kind | 21 / EMA | Period and type used when the MA filter is enabled |
| ATR_Period / ATR_Multiplier | 14 / 0.20 | ATR settings used to offset the arrow's display position |
| MinFVG_Pips | 0.0 (auto) | Minimum FVG width. 0 = automatic (ATR-based); a numeric value sets a ratio against ATR |
| bNotification / bEmailAlert | false / false | Toggle mobile push notification / email notification |
How to Use
- Attach the indicator to a chart
- When a cyan upward arrow (buy IFVG) or orange-red downward arrow (sell IFVG) appears, review the scene
- Turn on zone display (ShowZones) to visually track the price range where the IFVG formed
- If you find too much noise, adjust MinFVG_Pips or the filter settings
When one symbol isn't enough
Once you've confirmed real signs with IFVG Signals, the next question is natural: "Is this same opportunity happening on other symbols right now, too?" While you wait on one symbol, one chart, IFVGs are forming on symbols and timeframes you're not watching.
That's what the IFVG All Currency Scanner 448 Dashboard answers. It runs the same IFVG logic across up to 448 combinations (symbols × timeframes) at once.

A color-coded dashboard ─ one screen is all you need to watch
Each cell represents one symbol × one timeframe. Click a timeframe label and that symbol's chart on that timeframe opens instantly.

| Color | Meaning |
|---|---|
| YELLOW | Monitored OFF (symbol temporarily excluded) |
| CYAN | Timeframe currently meeting bullish conditions |
| RED | Timeframe currently meeting bearish conditions |
| PINK | Timeframe where a bearish alert just fired |
| BLUE | Timeframe where a bullish alert just fired |
| Symbol name in red text | An alert is currently active on that symbol |
Feature Summary
- Monitors up to 448 combinations (symbols × timeframes) simultaneously. Configuration is flexible (e.g. 56 symbols × 8 timeframes, 64 symbols × 7 timeframes)
- Judges the core ICT concept, IFVG, on confirmed bars only (no use of the forming bar, no repaint)
- Works with FX, Gold, and any symbol shown in your MT4 Market Watch
- Click a timeframe label and the target chart opens instantly
- Spread filter excludes symbols with temporarily wide spreads
- Supports email and mobile push notifications
- Display adjustments can extend monitoring to roughly 100 symbols
Real Trade Examples
Real examples of how IFVG plays out within the ICT AMD model: Accumulation → Manipulation → Distribution (the real, committed move).


Fact-review note: these are explanatory examples from specific dates, not a guarantee of win rate or repeatability. Do not use language implying "it works this way every time."
Trading Workflow

- Focus on IFVG: when the dashboard fires an alert, click the symbol to open its chart
- Check where price was swept: confirm where the recent high/low was swept, and use the key level to pinpoint an entry
- Then wait for the result: follow your own rules and wait for the outcome
| IFVG Signals (this article) | IFVG All Currency Scanner 448 Dashboard | |
|---|---|---|
| Price | Free | 35 USD |
| Coverage | 1 symbol, 1 chart | Up to 448 combinations (symbols × timeframes) on one screen |
| Switching charts | Manual symbol switching | Target chart opens instantly on timeframe click |
The more symbols you can monitor, the more often you encounter scenes where the conditions line up. With a larger pool of candidates, you no longer need to force an entry on the one scene in front of you ─ you can compare multiple candidates and be selective about which ones you take. This gap matters most for anyone who can't stay glued to charts all day.
▶ See the IFVG All Currency Scanner 448 Dashboard (MQL5, $35)