Shin Kojima / プロファイル
- 情報
|
no
経験
|
15
製品
|
0
デモバージョン
|
|
0
ジョブ
|
0
シグナル
|
0
購読者
|
• Custom Indicator Modifications
• Convert Your Indicator into a 448 Multi-Symbol & Multi-Timeframe Scanner
• MT4 ⇔ MT5 Conversion
• Feel free to contact me for your project or any questions.
▎ First 20 Downloads FREE ## 1. Overview $2014 MA Perfect Order All-Currency Scanner Detects "Perfect Order" moving average alignment across all currency pairs simultaneously. A Perfect Order occurs when 3-5 moving averages of increasing periods are stacked in a single, uninterrupted order $2014 proof that price is trending cleanly with no conflicting timeframes. BUY signal : Shorter-period MAs are all above longer-period MAs (fast-to-slow stack) -> strong uptrend
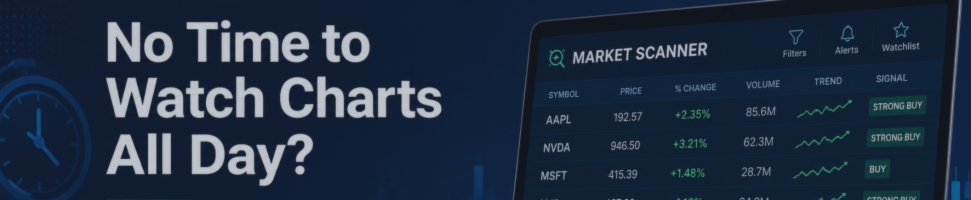
## 1. Overview Scan up to 64 symbols $FFFD~ 7 timeframes = 448 combinations simultaneously. --- ## 2. All-Currency Monitoring Series Tools that monitor all currency pairs at once become an incredibly powerful weapon once mastered ? a trading tool for life. The key is to match the right tool to your trading strategy. Here are the hottest tools available right now: - IFVG All-Currency Scanner The most effective tool for catching ICT fake-out moves.
================================================================ ShowKillZones v1.0 - NY AM終了を11→10、NY PM終了を17→16(キルゾーン時刻に修正) - NY AM/PM のラベルをKill Zoneに変更 v1.0 - 使用マニュアル ================================================================ 【概要】 ICTのKill Zone(セッション時間帯)をチャート上にゾーン表示し、 各セッションの高値・安値にアラートを出すインジケーター。 ・ロンドン / NY AM / NY PM は ET(米国東部時間)で入力 ・US夏時間(DST)を自動判定 → UTC変換を自動補正 ・前日高値/安値・上位足高値/安値・ラウンドナンバーも表示
Stoch Cross 448 Scanner Scan 64 pairs x 7 timeframes for stochastic golden/dead crosses — all from a single chart. | User Manual ------------------------------------------------------------------------ 1. Overview ------------------------------------------------------------------------ Stoch Cross 448 Scanner is a MetaTrader 4 indicator that monitors stochastic cross signals across 64 currency pairs and 7 timeframes simultaneously, displaying all results in a single panel. Drop it
================================================================ TradeInfoS_en - Trade Statistics Indicator for MT4 Copyright (C) 2014 fx-mt4ea.com ================================================================ OVERVIEW -------- Displays trade history statistics and market info in a separate indicator window. Shows results for All-time, This Month, and This Week in three columns. DISPLAY LAYOUT -------------- [ S ] T:xx/W:xx/L:xx/R:xx%/PL:xx <-
Reverse_Elements_AllSearch Reverse_Elements signals multi-symbol / multi-timeframe scanner for MetaTrader 4 ---------------------------------------------------------------------- Important Requirement ---------------------------------------------------------------------- Reverse_Elements_AllSearch requires the main Reverse_Elements indicator. Reverse_Elements_AllSearch is not a standalone signal-generation indicator. It is a scanner that reads signals from the main Reverse_Elements indicator
================================================================ DispTrade_en.mq4 User Manual ================================================================ OVERVIEW -------- Displays trade history and open positions visually on the MT4 chart using arrows and connecting lines. WHAT IT SHOWS ------------- - BUY Entry Arrow : Entry point for BUY orders (blue) - SELL Entry Arrow : Entry point for SELL orders (red) - Exit Arrow : Close
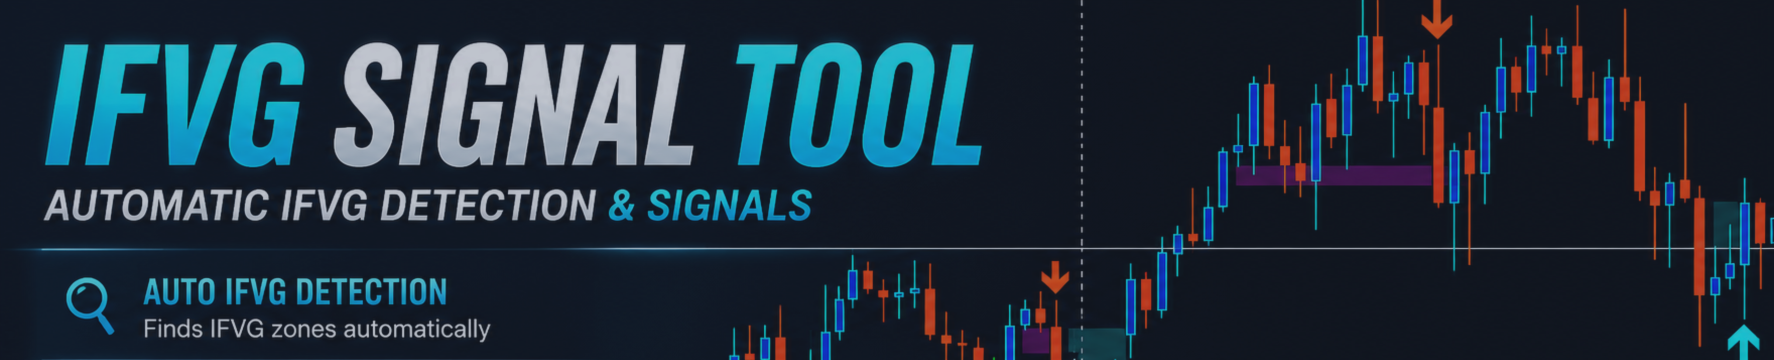
FREE for the First 100 Users ================================================================================ IFVG Signals Indicator (ICTIFVGmq4_en.mq4) ? User Manual ================================================================================ Version : 1.00 Platform: MetaTrader 4 Signal : IFVG Buy / IFVG Sell arrows on the main chart Zone : Horizontal rectangle drawn at the confirmed IFVG zone
RSI Border Search scans up to 64 symbols across 7 timeframes (448 combinations) in real time, detecting when RSI reaches overbought or oversold levels on confirmed bars. ═══ KEY FEATURES ═══ - Multi-Symbol Scanner: Monitor up to 64 symbols x 7 timeframes = 448 cells simultaneously. - RSI Boundary Detection: Detects when RSI crosses above or below your specified boundary level on confirmed (closed) bars. - No Repaint: Only confirmed bars are evaluated. The forming bar is never used, so signals
HigherTF Background Candle draws higher timeframe candlesticks directly on your chart background, giving you instant multi-timeframe context without switching charts. ═══ KEY FEATURES ═══ - Background HTF Candles: Renders Open/High/Low/Close of any higher timeframe as colored rectangles behind your price action. - Instant TF Switching: Press keys 1-9 to switch between M1, M5, M15, M30, H1, H4, D1, W1, MN1. Press 0 to hide. - Auto-Promotion: If the selected TF is equal to or lower than the chart
Reverse Elements - Formatted Description Reverse Elements Reverse Elements is a signal-based indicator designed to help identify potential market reversal points directly on the chart. Using a proprietary calculation method, the indicator displays buy and sell signals with arrows. It is built to support discretionary trading by making potential entry areas easier to recognize visually. This is not an Expert Advisor and does not place trades automatically. Main Features Buy and sell arrows
======================================= 50% OFF for the First 50 Users ======================================= ## 1. Overview ? ICT IFVG All-Currency Scanner Detects IFVG (Inverse Fair Value Gap) signals across all currency pairs simultaneously. An IFVG occurs when a candle body fully breaks through a prior Fair Value Gap in the OPPOSITE direction ? a key ICT concept indicating a potential institutional reversal. BUY signal : Bear FVG is broken upward →
First 50 Downloads Free AutoLineSaver for 448 Save and restore your chart workspace automatically. | User Manual 1. Overview AutoLineSaver automatically saves every line you draw on the chart and restores them the next time you open it. No more redrawing your analysis from scratch. Drop AutoLineSaver onto your chart once, and your workspace is always preserved. What it saves: • Horizontal lines • Trendlines • Rays (extended trendlines) • Vertical lines •
MA Cross 448 Scanner Scan 64 pairs x 7 timeframes for MA crossovers — all from a single chart. | User Manual ------------------------------------------------------------------------ 1. Overview ------------------------------------------------------------------------ MA Cross 448 Scanner is a MetaTrader 4 indicator that monitors moving average crossovers across 64 currency pairs and 7 timeframes simultaneously, displaying all results in a single panel. Drop it onto any chart and it