MQL5 で多色インジケーターを作成する
はじめに
MetaTrader 5 開発者の努力のおかげで、 MQL5 言語が生まれた。 多くの革新があるが、ここでは多色インジケーターの作成の可能性について説明し検討する。MQL4 でもラインに色を指定できたが、しかしライン全体で同じ色だった。多色のインジケーターはインジケーターバッファーの部分的重ね合わせを用いて作成され、便利ではなかった。
MQL5 言語は新しい可能性を提供した - インジケーターラインの各セクションに色を指定し (ラインに対して) 分離されたオブジェクト (バー、ローソク足、ヒストグラム、矢印) にも色を指定できる。この記事を理解するには、 MQL5 Referenceを一読するのが好ましい。 MQL5 Reference.
この論説では次の話題について考察するつもりである。
- インジケーターの基礎
- インジケーターのデータバッファー
- インジケーターのカラーインデックスバッファー
- RSI インジケーターの例で単色描画を多色のモードに変換 (DRAW_LINE から DRAW_COLOR_LINE 描画スタイルに変換) する方法
- RSI インジケーターの値によってろうそく足チャートを着色する (DRAW_COLOR_CANDLES 描画スタイル) 方法
- カラーインデックスのバッファーから値を得る方法
2つのカラー描画スタイルを考察しよう - DRAW_COLOR_LINE と DRAW_COLOR_CANDLES、残りの描画スタイルはバッファーの数が違うだけである。
なぜカラーのインジケーターか?
カラーのインジケーターを使うと、次のことができる:
- ローソク足で追加の情報を示す。
- 混合のインジケーターを作成する (MACD をRSI の値によって着色する)。
- インジケーターの重要なシグナルをハイライトする。
- 単に顧客の端末を飾る。
想像力を活性化しトレードをより便利にする。
MQL5 基礎
インジケーターの原理から始めよう。
一般に、インジケーターは入力データを得 (価格、その他のインジケーターのデータ)、ある計算を行いそしていくつかのバッファーをデータで埋める。 顧客の端末はその描画タイプに従ってインジケーターによって供給されるバッファーからの情報を描く。
描画スタイルは開発者によって定義される。インジケーターのバッファーはダブルタイプの配列であり、グローバルレベルで宣言される。あるスタイルに1つ以上のバッファーが必要とされると、いくつかのバッファーがグラフィックなプロットに組み合わされることがある。もしカスタムなインジケーターを作成したことがないなら、記事 (そこでは基本が詳しく説明されている): "MQL5: Create Your Own Indicator" および "Custom Indicators in MQL5 for Newbies"を読むと良い。
ここに最小限のカラーインジケーターのコードを示し、その要素を説明する。
//+------------------------------------------------------------------+
//|                                         test_color_indicator.mq5 |
//|                                                             ProF |
//|                                                          http:// |
//+------------------------------------------------------------------+
#property copyright "ProF"                      //Author
#property indicator_separate_window             //The indicator is plotted in a separate window
#property indicator_buffers 2                   //Number of indicator buffers
#property indicator_plots 1                     //Number of indicator plots
#property indicator_type1 DRAW_COLOR_HISTOGRAM  //Drawing style - Color Histogram
#property indicator_width1 3                    //Line width of a graphic plot (optional)
#property indicator_color1 Red,Green,BlueViolet //Specify 3 colors for a graphic plot

//Declaration of buffers
double buffer_line[]/*Data Buffer*/, buffer_color_line[]/*Color index buffer*/;

//+------------------------------------------------------------------+
//| Custom indicator initialization function                         |
//+------------------------------------------------------------------+
int OnInit()
  {
//Assign the data array with indicator's buffer
   SetIndexBuffer(0,buffer_line,INDICATOR_DATA);

//Assign the color indexes array with indicator's buffer
   SetIndexBuffer(1,buffer_color_line,INDICATOR_COLOR_INDEX);

//Specify the number of color indexes, used in the graphic plot
   PlotIndexSetInteger(0,PLOT_COLOR_INDEXES,2);

//Specify colors for each index
   PlotIndexSetInteger(0,PLOT_LINE_COLOR,0,Blue);   //Zeroth index -> Blue
   PlotIndexSetInteger(0,PLOT_LINE_COLOR,1,Orange); //First index  -> Orange
   return(0);
  }
//+------------------------------------------------------------------+
//| Custom indicator iteration function                              |
//+------------------------------------------------------------------+
int OnCalculate(const int rates_total,
                const int prev_calculated,
                const datetime &time[],
                const double &open[],
                const double &high[],
                const double &low[],
                const double &close[],
                const long &tick_volume[],
                const long &volume[],
                const int &spread[])
  {
   //For each bar we fill the data buffer and index color buffer with values
   for(int i=prev_calculated;i<=rates_total-1;i++)
     {
      //Lets add a simple drawing condition -> If opening price is greater than closing price, then:
      if(open[i]>close[i])
        {   buffer_color_line[i]=0;   }       //Assign color with index=zero (0)
      else
        {  buffer_color_line[i]=1;   }       //Assign color with index=one (1)

      //Specify the data for plotting, in our case it's the opening price
      buffer_line[i]=open[i];
     }

   return(rates_total-1); //Return the number of calculated bars,
                         //subtract 1 for the last bar recalculation
  }
//+------------------------------------------------------------------+
カラーインジケーターを書く詳細を調べていこう。
#property indicator_buffers 2 //Number of indicator's buffers
#property indicator_plots 1   //Number of graphic plots
最初のラインでインジケーターバッファーの数を指定する、この例では2つのバッファーである。
- この開始価格の例でのインジケーターデータのためのバッファー;
- カラーインデックスのためのバッファー。
2行目で、グラフィックスの数を指定する。グラフィックスとインジケーターバッファーを区別することは重要である。グラフィックスはインジケーターのライン (ローソク足、バー、矢印など)である。 インジケーターバッファーは描画に必要なデータの配列で、カラーインデックスの配列あるいはインジケーターの内部計算のための配列 (このタイプはインジケーターのウインドウで描かれない)である。
描画の数はバッファーの数と等しいか少なく、描画のスタイルと計算のためのバッファーの数による。描画のスタイルと各スタイルに必要なバッファーの数の表はMQL5 Referenceの描画スタイルの章にある。
最も興味深い内容が以下:
#property indicator_type1 DRAW_COLOR_HISTOGRAM  //Drawing style-color histogram
#property indicator_width1 3                    //Drawing line width (optional)
#property indicator_color1 Red,Green,BlueViolet //Specify 3 colors for a graphic plot
第1行で、描画スタイルを指定する、ここでの例では描画スタイルはゼロラインからのヒストグラムである。この描画スタイルはデータバッファーとカラーインデックスのバッファーを必要とする。「カラー」の語を含む全ての描画スタイルはカラーインデックスのためのバッファーを必要とする。
第2行では、ラインの幅を3画素と指定している、初期設定ではラインの幅は1画素に設定されている。
第3行では、グラフィックスのインデックスのためのカラーを指定している、この例では、3つのカラー "Red", "Green" と "BlueViolet"を指定している。カラーインデックスは0から始まる: 0-"Red", 1-"Green", 2-"BlueViolet"。カラーはグラフィックスのカラー設定に必要である。カラーは数通りの方法で指定できる、 "#property indicator_color1" はその1つである。これは "静的な" 方法で、プログラムのコンパイルの段階で使われる。第2の方法は以下に説明される。
double buffer_line[]/*Data buffer*/, buffer_color_line[]/*Color indexes buffer*/;
ここでバッファーとして使われる2つの配列を宣言する、第1はデータバッファーとして、第2はカラーインデックスとして、どちらもダブルのタイプの配列として宣言される。
インジケーターの初期化ファンクションについて考える。
SetIndexBuffer(0,buffer_line,INDICATOR_DATA);
ここでインジケーターバッファー に配列を割り当て、"INDICATOR_DATA" のバッファーのタイプはこのバッファーがインジケーターの値を保存するのに使われることを意味する (すなわちインジケーターのデータバッファーである)。注意、第1パラメーターはゼロ (0)である - それはバッファーインデックスである。.
SetIndexBuffer(1,buffer_color_line,INDICATOR_COLOR_INDEX);
ここでインジケーターバッファーに配列を割り当て、"INDICATOR_COLOR_INDEX" をバッファーのタイプとして指定する - これはこのバッファーが’インジケーターの各バーに対するカラーインデックスを保存するのに使われる。注意、第1パラメーターは (1)である - それはバッファーインデックスである。.
バッファーの順序は特別でなければならない:まず最初にインジケーターデータバッファー、そしてカラーインデックスバッファー。
最後に、グラフィックスのカラーを指定する第2の方法 (カラーインデックスを指定するための):
//Specify the number of color indexes, used in the graphics
PlotIndexSetInteger(0,PLOT_COLOR_INDEXES,2);
ここでカラーインデックスの数を指定する。ファンクションの第1パラメーターは "0"であり、それは graphics インデックスである。. この例ではカラーインデックスの数を指定しなければならない (第1の方法で、コンパイラーがそれを計算する)。
PlotIndexSetInteger(0,PLOT_LINE_COLOR,0,Blue);   //Zeroth index -> Blue
PlotIndexSetInteger(0,PLOT_LINE_COLOR,1,Orange); //First index  -> Orange
ここで各インデックスのカラーを指定する。ファンクションの第1パラメーターはグラフィックスのインデックスであり、第2のパラメーターはゼロから始まるカラーインデックスである。カラーインデックスを設定する第2の方法は次の点で異なる:カラーの数とそのインデックスは例えばファンクションを使って動的に指定することもできる。両方の方法を使うときには、動的な方法が静的(第1の)な方法に優先することを忘れないことである。
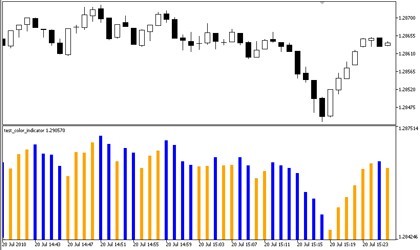
次に OnCalculate ファンクションを考察する、インジケーター のグラフィックスのためにバッファーの値を計算する。ヒストグラムのカラーの選択のために最も簡単なルールを選ぶ、もし開始の価格が終了の価格より大きければ、現在のバッファー要素を( "buffer_color_line" 配列に) ゼロに等しい (0) カラーインデックスを割り当てる。カラーインデックスのゼロ (0) は上で指定した"青"‘に対応する。
もし、開始価格が終了価格より低ければ、カラーインデックスを、1に等しく割り当てる、これはオレンジカラーである。この簡単な例を示す:

見て分かるように、かんたんである、少し想像を必要とするだけである。
カラー設定の方法
ここで、カラー設定の詳細を検討する。
MQL5 Reference によると the color は異なった方法を使って指定できる。
- 文字通り
- 数字的に;
- カラーの名前を使って;
これら全てを考察しよう。
文字通り
color color_var = C'10,20,255';
color color_var = C'0x0A,0x14,0xFF';
カラーは RGBに従って定義される (Red, Green, Blue)、どの色もこれら3つの色の合計として表現される。従って、第1の数は赤色の要素に対応している。第2の数は緑色に、第3は青色に対応している。数は (十進法で) 0 から 255までをとり得る。十六進法では、値は 00 から FFまで可能である。
第1と第2のラインは等しい:color_var変数に青色を割り当てる。違いは指定した数のシステムでの数による表現であり、第1行に十進法、第2行に十六進法である。ここには何の違いもない、ただ便利な方法を選べばよい。小さな数は暗い色に対応し、白色は: "C'255,255,255'" あるいは "C'0xFF,0xFF,0xFF'", 黒色は: "C'0,0,0'" あるいは "C'0x00,0x00,0x00'"である。
数字的に;
color color_var = 0xFFFFFF;  // white
color color_var = 0x0000FF;  // red
color color_var = 16777215   // white
color color_var = 0x008000   // green
color color_var = 32768      // green
カラーは十六進数と十進数で表現されている。例えば、 "0x0000FF" の値は "C'0xFF,0x00,0x00'"と等しい、見れば分かるように最初と最後の数字のペアは入れ替わっている。
十進数の16777215 の値を得るために、数 FFFFFF を十六進数から十進数に変換しなければならない。
カラーの名前
color color_var = Red;    //red
color color_var = Blue;   //blue
color color_var = Orange; //orange
これは最も簡単な方法であるが、 web-colors のセットの中からのカラーのみを指定できる。
色を指定する方法を纏めてみよう。
これら3つの方法は等しい、例えば:
color color1 = C'255,0,0';
color color2 = C'0xFF,0x00,0x00';
color color3 = 0x0000FF;
color color4 = 255;
color color5 = Red;

Alert((color1==color2)
       && (color1==color2)
       && (color1==color4)
       && (color1==color5)); //prints true
練習
基本を学んだので、チャートのローソク足を異なった色で塗る方法を考えよう。カラーのローソク足を作成するためには、強制カラーローソク足をチャート上に描くインジケーターを書く必要がある。
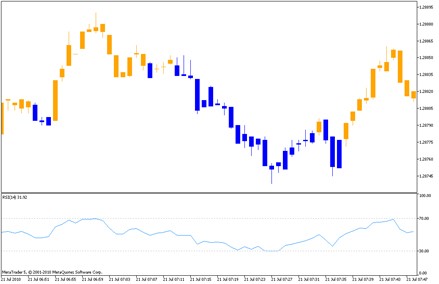
ここにインジケーターのコードがある、 RSI の値が 50% 以下なら、青色の ローソク足、そうでなければローソク足をオレンジ色で描く。
読者の混乱を避けるため、データの正しさのチェックとエラー処理は無い。しかし、インジケーターの実際のコードを書くときにはこれらの詳細を考慮しなければいけない。
//+------------------------------------------------------------------+
//|                                                   cand_color.mq5 |
//|                                                             ProF |
//|                                                          http:// |
//+------------------------------------------------------------------+
#property copyright "ProF"                      //Author
#property indicator_chart_window                //Indicator in separate window

                                          //Specify the number of buffers of the indicator
//4 buffer for candles + 1 color buffer + 1 buffer to serve the RSI data
#property indicator_buffers 6

//Specify the names in the Data Window
#property indicator_label1 "Open;High;Low;Close"

#property indicator_plots 1                     //Number of graphic plots
#property indicator_type1 DRAW_COLOR_CANDLES    //Drawing style - color candles
#property indicator_width1 3                    //Width of the graphic plot (optional)

                                          //Declaration of buffers
double buffer_open[],buffer_high[],buffer_low[],buffer_close[]; //Buffers for data
double buffer_color_line[];    //Buffer for color indexes
double buffer_tmp[1];           //Temporary buffer for RSI data copying
double buffer_RSI[];            //Indicator buffer for RSI
int handle_rsi=0;               //Handle for the RSI indicator
//+------------------------------------------------------------------+
//| Custom indicator initialization function                         |
//+------------------------------------------------------------------+
int OnInit()
  {
/**
        *       The order of the buffers assign is VERY IMPORTANT!
        *  The data buffers are first
        *       The color buffers are next
        *       And finally, the buffers for the internal calculations.
        */
//Assign the arrays with the indicator's buffers
   SetIndexBuffer(0,buffer_open,INDICATOR_DATA);
   SetIndexBuffer(1,buffer_high,INDICATOR_DATA);
   SetIndexBuffer(2,buffer_low,INDICATOR_DATA);
   SetIndexBuffer(3,buffer_close,INDICATOR_DATA);

//Assign the array with color indexes with the indicator's color indexes buffer
   SetIndexBuffer(4,buffer_color_line,INDICATOR_COLOR_INDEX);

//Assign the array with the RSI indicator data buffer
   SetIndexBuffer(5,buffer_RSI,INDICATOR_CALCULATIONS);

//Define the number of color indexes, used for a graphic plot
   PlotIndexSetInteger(0,PLOT_COLOR_INDEXES,2);

//Set color for each index
   PlotIndexSetInteger(0,PLOT_LINE_COLOR,0,Blue);   //Zeroth index -> Blue
   PlotIndexSetInteger(0,PLOT_LINE_COLOR,1,Orange); //First index  -> Orande

//Get handle of RSI indicator, it's necessary to get the RSI indicator values
   handle_rsi=iCustom(_Symbol,_Period,"Examples\\RSI");
   return(0);
  }
//+------------------------------------------------------------------+
//| Custom indicator iteration function                              |
//+------------------------------------------------------------------+
int OnCalculate(const int rates_total,
                const int prev_calculated,
                const datetime &time[],
                const double &open[],
                const double &high[],
                const double &low[],
                const double &close[],
                const long &tick_volume[],
                const long &volume[],
                const int &spread[])
  {
//In the loop we fill the data buffers and color indexes buffers for each bar
   for(int i=prev_calculated;i<=rates_total-1;i++)
     {
      //Copying the RSI indicator's data to the temporary buffer - buffer_tmp
      CopyBuffer(handle_rsi,0,BarsCalculated(handle_rsi)-i-1,1,buffer_tmp);
      //Copying the values from the temporary buffer to the indicator's buffer
      buffer_RSI[i]=buffer_tmp[0];

      //Set data for plotting
      buffer_open[i]=open[i];  //Open price
      buffer_high[i]=high[i];  //High price
      buffer_low[i]=low[i];    //Low price
      buffer_close[i]=close[i];//Close price

                               //Add a simple condition -> If RSI less 50%:
      if(buffer_RSI[i]<50)
        {   buffer_color_line[i]=0;   } //Assign the bar with color index, equal to 0
      else
        {  buffer_color_line[i]=1;   }  //Assign the bar with color index, equal to 1
     }
   return(rates_total-1); //Return the number of calculated bars,
                         //Subtract 1 for the last bar recalculation
  }
//+------------------------------------------------------------------+
こちらにそれがどのように見えるかがある:

よく見える、しかしさらに先に進もう。
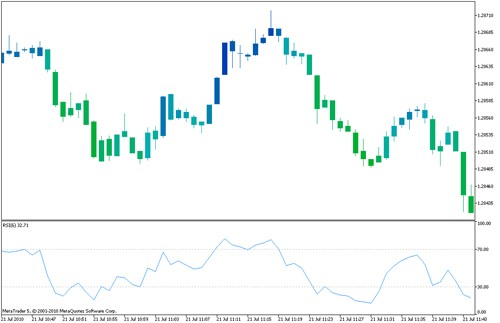
RSI の値によってローソク足を多くの色を用いて着色する、いわゆる諧調充填法である。
カラーは手で指定することができるが、30-40 色を指定するのが便利で簡単である。これを次のように行う:2通りのファンクションを書く、第1はカラーインデックス、第2はカラーをファンクションの引数によって得るものである。アイデアはコメントに書かれる。
//+------------------------------------------------------------------+
//|                                               cand_color_RSI.mq5 |
//|                                                             ProF |
//|                                                          http:// |
//+------------------------------------------------------------------+
#property copyright "ProF"                      //Author
#property indicator_chart_window                //Indicator in a separate window

//Specify the number of indicator's buffers
//4 buffers for candles + 1 buffer for color indexes + 1 buffer to store the data of RSI
#property indicator_buffers 6

//Specify the names, shown in the Data Window
#property indicator_label1 "Open;High;Low;Close"

#property indicator_plots 1                     //Number of graphic plots
#property indicator_type1 DRAW_COLOR_CANDLES    //Drawing style - colored candles
#property indicator_width1 3                    //Width of a line (optional)

                                          //Declaration of buffers
double buffer_open[],buffer_high[],buffer_low[],buffer_close[];//Buffers for data
double buffer_color_line[];     //Buffer for color indexes
double buffer_tmp[1];          //Temporary buffer for RSI values
double buffer_RSI[];            //Indicator buffer for RSI
int handle_rsi=0;               //Handle of the RSI indicator
//+------------------------------------------------------------------+
//|    Set colors for a graphic plot            |
//+------------------------------------------------------------------+
/*
*       The function sets colors for a graphic plot
*       50 colors from Green to Blue.
*       The index of a graphic plot is passed to the function.

void setPlotColor(int plot)
  {
   PlotIndexSetInteger(plot,PLOT_COLOR_INDEXES,50); //Specify the number of colors

                                               //In the loops we specify the colors
   for(int i=0;i<=24;i++)
     {
      PlotIndexSetInteger(plot,PLOT_LINE_COLOR,i,StringToColor("\"0,175,"+IntegerToString(i*7)+"\""));
     }
   for(int i=0;i<=24;i++)
     {
      PlotIndexSetInteger(plot,PLOT_LINE_COLOR,i+25,StringToColor("\"0,"+IntegerToString(175-i*7)+",175\""));
     }
  }
//+------------------------------------------------------------------+
//|  Get index of the color                                          |
//+------------------------------------------------------------------+
/*
*       The function returns the index of the color
*       The first parameter is the current value of the indicator
*       The second parameter is the minimal value of the indicator
*       The third parameter is the maximal value of the indicator
*/
int getPlotColor(double current,double min,double max)
  {
   return((int)NormalizeDouble((50/(max-min))*current,0));
  }
//+------------------------------------------------------------------+
//| Custom indicator initialization function                         |
//+------------------------------------------------------------------+
int OnInit()
  {
/**
        *
        *       The order of the buffers assign is VERY IMPORTANT!
        *  The data buffers are first
        *       The color buffers are next
        *       And finally, the buffers for the internal calculations.
        */
//Assign the arrays with the indicator buffers
   SetIndexBuffer(0,buffer_open,INDICATOR_DATA);
   SetIndexBuffer(1,buffer_high,INDICATOR_DATA);
   SetIndexBuffer(2,buffer_low,INDICATOR_DATA);
   SetIndexBuffer(3,buffer_close,INDICATOR_DATA);

//Assign the array with the color indexes buffer
   SetIndexBuffer(4,buffer_color_line,INDICATOR_COLOR_INDEX);

//Assign the array with RSI indicator buffer
   SetIndexBuffer(5,buffer_RSI,INDICATOR_CALCULATIONS);

//Specify color indexes
   setPlotColor(0);

//Get handle of the RSI indicator, it's necessary get its values
   handle_rsi=iCustom(_Symbol,_Period,"Examples\\RSI",6);
   return(0);
  }
//+------------------------------------------------------------------+
//| Custom indicator iteration function                              |
//+------------------------------------------------------------------+
int OnCalculate(const int rates_total,
                const int prev_calculated,
                const datetime &time[],
                const double &open[],
                const double &high[],
                const double &low[],
                const double &close[],
                const long &tick_volume[],
                const long &volume[],
                const int &spread[])
  {
//For each bar we fill the data buffers and buffer with color indexes using the loop
   for(int i=prev_calculated;i<=rates_total-1;i++)
     {
      //Copying the RSI indicator data to the temporary buffer buffer_tmp
      CopyBuffer(handle_rsi,0,BarsCalculated(handle_rsi)-i-1,1,buffer_tmp);
      //Then copying the data from the temporary buffer
      buffer_RSI[i]=buffer_tmp[0];

      //Specify the data for plotting
      buffer_open[i]=open[i];  //Open price
      buffer_high[i]=high[i];  //High price
      buffer_low[i]=low[i];    //Low price
      buffer_close[i]=close[i];//Close price

      //Paint the candles depending on RSI indicator values
      //RSI = 0     - candle is Green
      //RSI = 100   - candle is Blue
      //0<RSI<100   - candle color is between Green and Blue
      buffer_color_line[i]=getPlotColor(buffer_RSI[i],0,100);

     }
   return(rates_total-1); //Return the number of calculated bars,
                         //Subtract 1 for the last bar recalculation
  }
//+------------------------------------------------------------------+
ここにそれがどのように見えるかがある:

例として使う、他の色を設定するRSI を他のインジケーターで置き直す。
練習は常に重要である。
描画スタイル:従来法と多色
既存のインジケーターを着色できる、そのため次のことを行う必要がある:描画スタイルを多色に変える、バッファーを加える、インジケーターバッファーに割り当てるそして着色の詳細を指定する。
ここに従来の描画スタイルと対応する多色(着色)描画スタイルの表がある。
| 従来 | 変更後 |
|---|---|
| DRAW_LINE | DRAW_COLOR_LINE |
| DRAW_SECTION | DRAW_COLOR_SECTION |
| DRAW_HISTOGRAM | DRAW_COLOR_HISTOGRAM |
| DRAW_HISTOGRAM2 | DRAW_COLOR_HISTOGRAM2 |
| DRAW_ARROW | DRAW_COLOR_ARROW |
| DRAW_ZIGZAG | DRAW_COLOR_ZIGZAG (example) |
| DRAW_CANDLES | DRAW_COLOR_CANDLES |
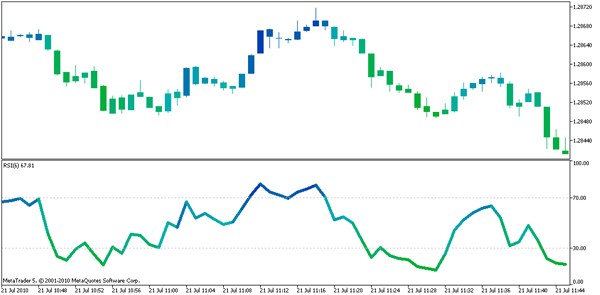
ここに改造したRSIのコードがある、その値によって着色される。
全ての改造はコメントされている。
//+------------------------------------------------------------------+
//|                                                          RSI.mq5 |
//|                        Copyright 2009, MetaQuotes Software Corp. |
//|                                              http://www.mql5.com |
//+------------------------------------------------------------------+
#property copyright   "2009, MetaQuotes Software Corp."
#property link        "http://www.mql5.com"
#property description "Relative Strength Index"
//--- indicator settings
#property indicator_separate_window
#property indicator_minimum 0
#property indicator_maximum 100
#property indicator_level1 30
#property indicator_level2 70
/////////////////////////////////////////////////////////////////////
#property indicator_buffers 4 //The number of buffers has increased by 1
#property indicator_width1 5  //The line width has set to 4 pixels
/////////////////////////////////////////////////////////////////////
#property indicator_plots   1
/////////////////////////////////////////////////////////////////////
//Drawing style has been changed from DRAW_LINE to DRAW_COLOR_LINE
#property indicator_type1   DRAW_COLOR_LINE
/////////////////////////////////////////////////////////////////////
#property indicator_color1  DodgerBlue
//--- input parameters
input int InpPeriodRSI=14; // Period
//--- indicator buffers
double    ExtRSIBuffer[];
double    ExtPosBuffer[];
double    ExtNegBuffer[];
//--- global variable
int       ExtPeriodRSI;

//////////////////////////////////////////////////////////////////////
double buffer_color[]; //Declare an array for color indexes

//Added two functions
//+------------------------------------------------------------------+
//|    Set colors for a graphic plot                                  |
//+------------------------------------------------------------------+
/*
*       The function specify the color for a graphic plot
*       50 colors from Green to Blue.
*       The index of a graphic plot is passed to the function.
*/
void setPlotColor(int plot)
  {
   PlotIndexSetInteger(plot,PLOT_COLOR_INDEXES,50); //Set number of colors

                                                    //Specify colors in loop
   for(int i=0;i<=24;i++)
     {
      PlotIndexSetInteger(plot,PLOT_LINE_COLOR,i,StringToColor("\"0,175,"+IntegerToString(i*7)+"\""));
     }
   for(int i=0;i<=24;i++)
     {
      PlotIndexSetInteger(plot,PLOT_LINE_COLOR,i+25,StringToColor("\"0,"+IntegerToString(175-i*7)+",175\""));
     }
  }
//+------------------------------------------------------------------+
//|  Get index of the color                                           |
//+------------------------------------------------------------------+
/*
*       The function returns the color index
*       The first parameter is the current value of the indicator
*       The second parameter is the minimal value of the indicator
*       The third parameter is the maximal value of the indicator
*/
int getPlotColor(double current,double min,double max)
  {
   return((int)NormalizeDouble((50/(max-min))*current,0));
  }
//////////////////////////////////////////////////////////////////////


//+------------------------------------------------------------------+
//| Custom indicator initialization function                         |
//+------------------------------------------------------------------+
void OnInit()
  {
//--- check for input
   if(InpPeriodRSI<1)
     {
      ExtPeriodRSI=12;
      Print("Incorrect value for input variable InpPeriodRSI =",InpPeriodRSI,
            "Indicator will use value =",ExtPeriodRSI,"for calculations.");
     }
   else ExtPeriodRSI=InpPeriodRSI;
//--- indicator buffers mapping
   SetIndexBuffer(0,ExtRSIBuffer,INDICATOR_DATA);

/////////////////////////////////////////////////////////////////////
//Assign the array with buffer of color indexes
        SetIndexBuffer(1,buffer_color,INDICATOR_COLOR_INDEX);
//The order of buffers is changed!
        SetIndexBuffer(2,ExtPosBuffer,INDICATOR_CALCULATIONS);
   SetIndexBuffer(3,ExtNegBuffer,INDICATOR_CALCULATIONS);
//Set colors
   setPlotColor(0);
/////////////////////////////////////////////////////////////////////

//--- set accuracy
   IndicatorSetInteger(INDICATOR_DIGITS,2);
//--- sets first bar from what index will be drawn
   PlotIndexSetInteger(0,PLOT_DRAW_BEGIN,ExtPeriodRSI);
//--- name for DataWindow and indicator subwindow label
   IndicatorSetString(INDICATOR_SHORTNAME,"RSI("+string(ExtPeriodRSI)+")");
//--- initialization done
  }
//+------------------------------------------------------------------+
//| Relative Strength Index                                          |
//+------------------------------------------------------------------+
int OnCalculate(const int rates_total,
                const int prev_calculated,
                const int begin,
                const double &price[])
  {
   int    i;
   double diff;
//--- check for rates count
   if(rates_total<=ExtPeriodRSI)
      return(0);
//--- preliminary calculations
   int pos=prev_calculated-1;
   if(pos<=ExtPeriodRSI)
     {
      //--- first RSIPeriod values of the indicator are not calculated
      ExtRSIBuffer[0]=0.0;
      ExtPosBuffer[0]=0.0;
      ExtNegBuffer[0]=0.0;
      double SumP=0.0;
      double SumN=0.0;
      for(i=1;i<=ExtPeriodRSI;i++)
        {
         ExtRSIBuffer[i]=0.0;
         ExtPosBuffer[i]=0.0;
         ExtNegBuffer[i]=0.0;
         diff=price[i]-price[i-1];
         SumP+=(diff>0?diff:0);
         SumN+=(diff<0?-diff:0);
        }
      //--- calculate first visible value
      ExtPosBuffer[ExtPeriodRSI]=SumP/ExtPeriodRSI;
      ExtNegBuffer[ExtPeriodRSI]=SumN/ExtPeriodRSI;
      ExtRSIBuffer[ExtPeriodRSI]=100.0-(100.0/(1.0+ExtPosBuffer[ExtPeriodRSI]/ExtNegBuffer[ExtPeriodRSI]));
      //--- prepare the position value for main calculation
      pos=ExtPeriodRSI+1;
     }
//--- the main loop of calculations
   for(i=pos;i<rates_total;i++)
     {
      diff=price[i]-price[i-1];
      ExtPosBuffer[i]=(ExtPosBuffer[i-1]*(ExtPeriodRSI-1)+(diff>0.0?diff:0.0))/ExtPeriodRSI;
      ExtNegBuffer[i]=(ExtNegBuffer[i-1]*(ExtPeriodRSI-1)+(diff<0.0?-diff:0.0))/ExtPeriodRSI;
      ExtRSIBuffer[i]=100.0-100.0/(1+ExtPosBuffer[i]/ExtNegBuffer[i]);
/////////////////////////////////////////////////////////////////////
//Paint it
                buffer_color[i] = getPlotColor(ExtRSIBuffer[i],0,100);
/////////////////////////////////////////////////////////////////////
     }
//--- OnCalculate done. Return new prev_calculated.
   return(rates_total);
  }
//+------------------------------------------------------------------+
さあこれでローソク足とRSI のカラーを比較できる。

Expert Advisor/Indicator/Script‘‘のインジケーターのカラーの値を得る方法
エキスパートアドバイザーの自動化トレーディング、あるいは、何かそのほかの目的のためラインの色を得ることがしばしば必要になる。
実装は簡単である、スクリプトを見てみよう。
//+------------------------------------------------------------------+
//|                                                         test.mq5 |
//|                                                             ProF |
//|                                                          http:// |
//+------------------------------------------------------------------+
#property copyright "ProF"
#property link      "http://"
#property version   "1.00"
//+------------------------------------------------------------------+
//| Script program start function                                    |
//+------------------------------------------------------------------+
void OnStart()
  {
        int handle = 0; //handle of the indicator
        double tmp[1];  //temporary array for color index buffer.
        //Get the handle of our modified RSI
        handle = iCustom(_Symbol,_Period,"Examples\\RSI",6);

        //Let's remember, that values are stored in the buffer 1 of our modified RSI
        //The color indexes are stored in the buffer 0
        //Copying the data from the buffer "1" of the RSI indicator.
        CopyBuffer(handle,1,0,1,tmp);

        //Show alert with last color index, returned by RSI
        Alert(tmp[0]); //For example, if returned 0, it means that RSI
        //is painted with Green color and its current level is near 0.
  }
//+-----------------------------------------------------------------+
カラーインデックスとカラーの値の間の対応を知らなければならない。さらに、カラーインデックスのバッファーを知らなければならない。
それを見つけるため、カラーインデックス設定の判断基準を理解するか、あるいはそれらを実験的にこのコードあるいは他の方法で決定する必要がある。
結論
次の MQL5 描画スタイルを調べた: DRAW_COLOR_LINE, DRAW_COLOR_CANDLES。ローソク足 を着色し、RSI インジケーターを着色する方法を学んだ (DRAW_LINE -> DRAW_COLOR_LINE)。さらに、カラーバッファーのインデックスの値を得る方法を学んだ。
MQL5 言語は多くの描画スタイルを持ち、人の想像力のみが制限である。色つきのラインは市場をよりよく見ることを可能にする。
より快適なトレーディングのための新しい機会を使用しましょう。
MetaQuotes Ltdによってロシア語から翻訳されました。
元の記事: https://www.mql5.com/ru/articles/135
警告: これらの資料についてのすべての権利はMetaQuotes Ltd.が保有しています。これらの資料の全部または一部の複製や再プリントは禁じられています。
この記事はサイトのユーザーによって執筆されたものであり、著者の個人的な見解を反映しています。MetaQuotes Ltdは、提示された情報の正確性や、記載されているソリューション、戦略、または推奨事項の使用によって生じたいかなる結果についても責任を負いません。
 MQL5でのトレードオペレーション - 簡単です
 オーダーストラテジー多目的Expert Advisor
 一瞬でトレードロボットを作る方法
- 無料取引アプリ
- 8千を超えるシグナルをコピー
- 金融ニュースで金融マーケットを探索
バッファインデックスは、コンストラクションインデックスと同じであってはならない。これらはそれぞれ独自の表示を持っています。PlotIndexSetInteger(1, PLOT_DRAW_TYPE, DRAW_LINE)を試して ください;
もうひとつ教えていただきたいのですが、線の順番を変えて、目的の線が上に来るようにすることはできるのでしょうか?それともバッファの宣言順だけでしょうか?例えば、0番目のバッファをメインラインに対応させ、フィルチャンネルを最後にしたかったのですが、すべて重なってしまいました)。Expert Advisorでインジケーターを使用してデータを便利に取得するつもりなので、これは便利です。
もうひとつ教えていただきたいのですが、必要な行が上に来るように行の順番を変えることはできますか?それともバッファ宣言の順番だけですか?例えば、0番目のバッファをメインラインに対応させたかったのですが、フィルチャネルは最後にあったのですが、すべて重なって しまいました)。これは、Expert Advisorでインジケータを使用してデータを便利に取得する予定なので便利です。
私は何も理解していない。また、Expert Advisorに取り込むバッファの番号にどのような違いがあるのでしょうか?
理解できない。また、Expert Advisorに取り込むバッファの数値にどのような違いがあるのでしょうか?
ゼロのバッファが必要だとわかっているときだけで、それだけです)だから、インデューサーを見て、どれが必要かを確認する必要があるのです。そのようなものはありません)。
ゼロのバッファーが必要だとわかっているときだけで、それだけです)だから、インデューサーを見て、どれが必要かを確認する必要があります。それで、イエス・ノー)。
Expert Advisorを書くときは、どのバッファをコピーするか、どの値にどう反応するかを指定する必要があります。
Expert Advisorを書く際には、どのバッファをコピーし、どの値にどのように反応するかを指定する必要がある。
そうです。本当にありがとうございました。)