Standard Deviation Channel Dashboard
- Indicatori
- Versione: 2.70
- Aggiornato: 19 luglio 2026
- Attivazioni: 10

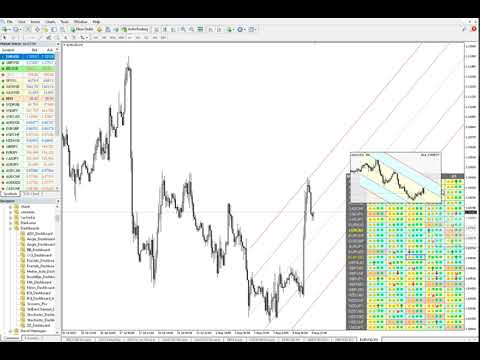
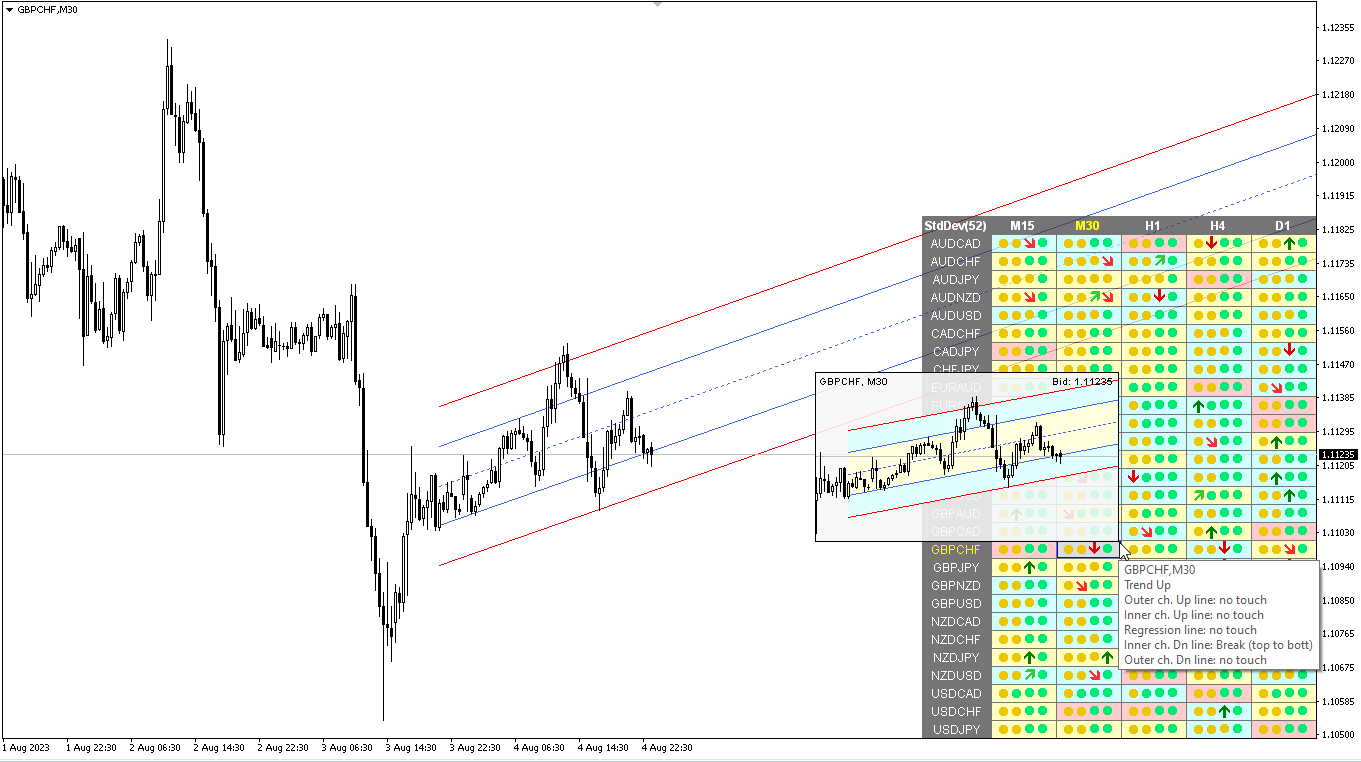
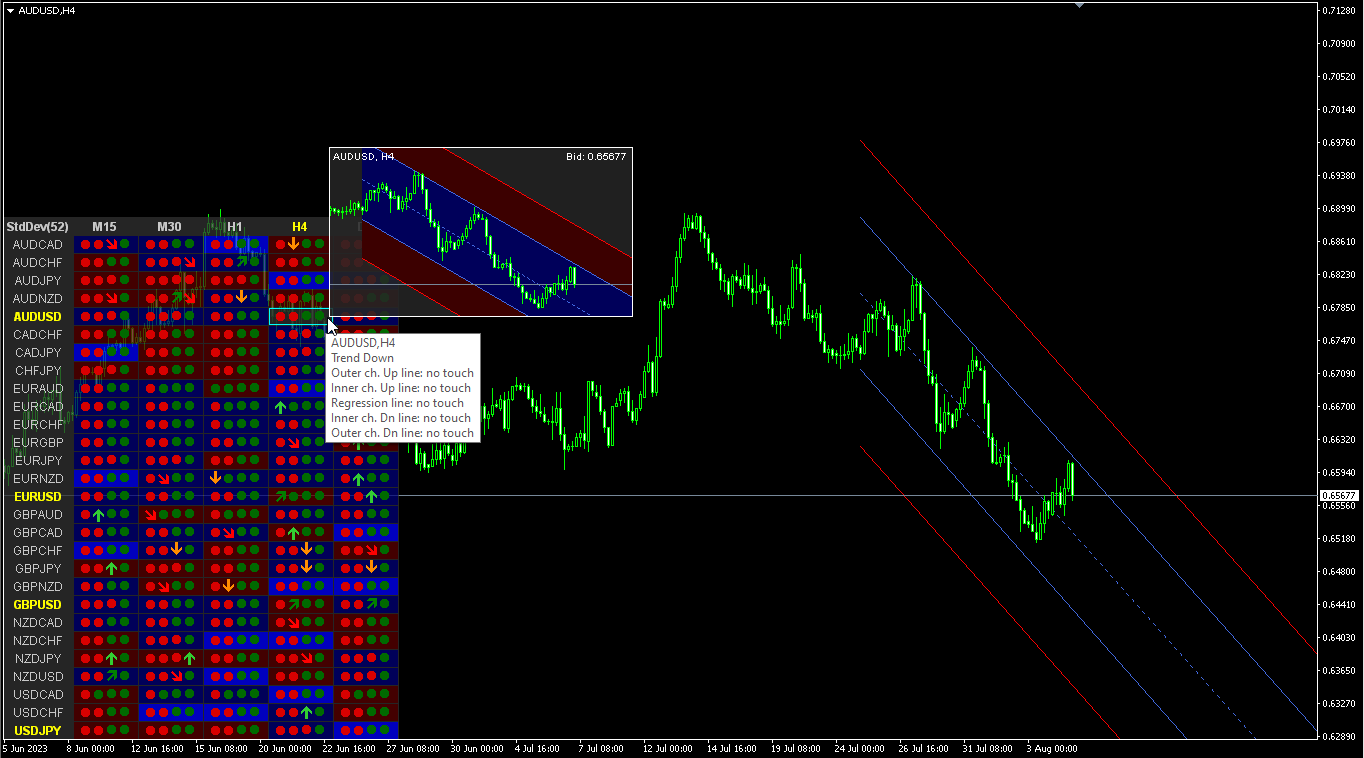
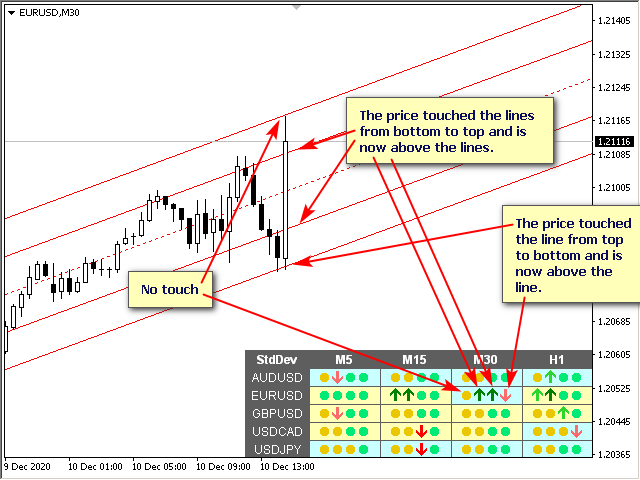
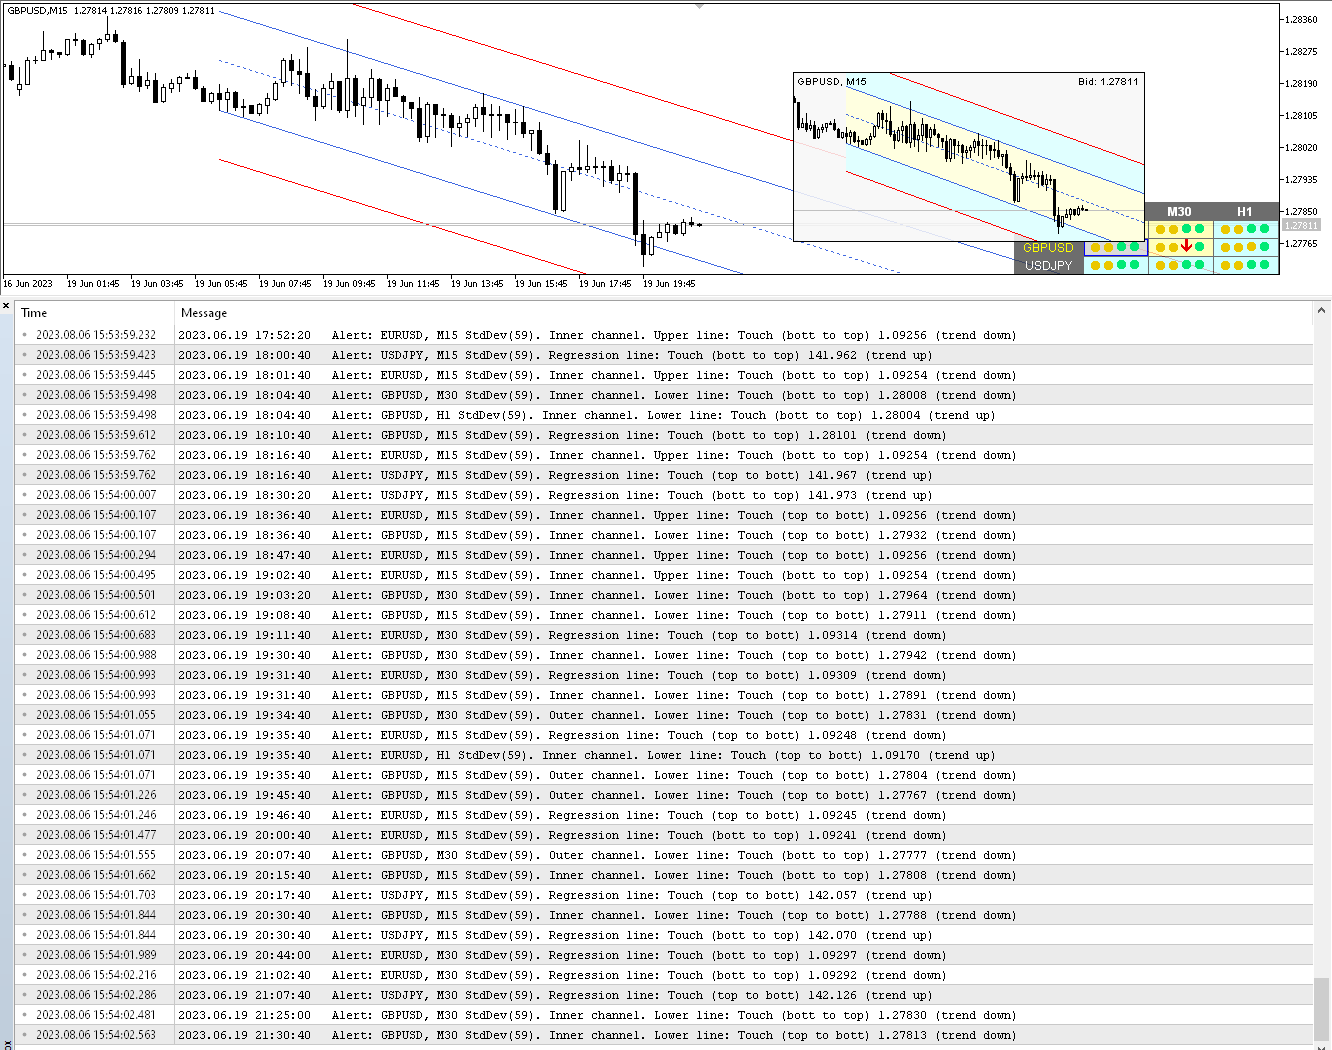
Multicurrency and multitimeframe indicator of the Standard Deviation Channel. Displays the current direction of the market. On the panel, you can see breakouts and touches (by price) of the levels of the linear regression channel. In the parameters, you can specify any desired currencies and timeframes. Also, the indicator can send notifications when levels are touched. By clicking on a cell, this symbol and period will be opened. This is MTF Scanner.
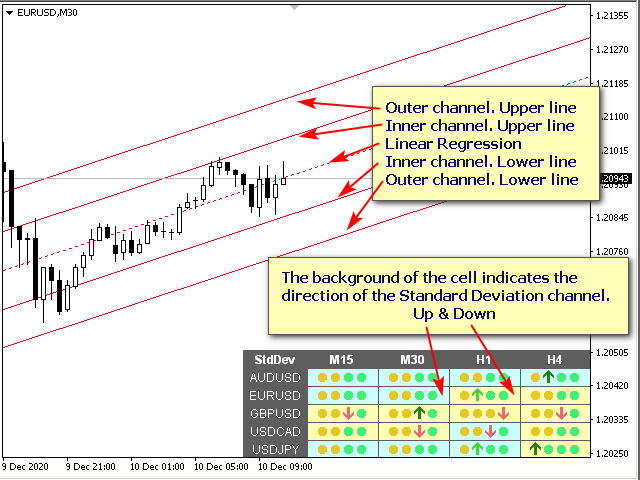
The key to hide the dashboard from the chart is "D" by default«Standard Deviation Channel is built on base of Linear Regression Trend representing a usual trendline built between two points on the price chart using the method of least squares. As a result, this line proves to be the exact median line of the changing price. It can be considered as an equilibrium price line, and any deflection up or down indicates the superactivity of buyers or sellers respectively.
Standard Deviation Channel consists of two parallel lines, equidistant up and down from the Linear Regression Trend. The distance between frame of the channel and regression line equals to the value of the standard deviation of the close price from the regression line. All price changes take place within Standard Deviation Channel, where the lower frame works as support line, and the upper one does as resistance line. Prices usually exceed the channel frames for a short time. If they keep outside of the channel frames for a longer time than usually, it forecasts the possibility of trend turn».
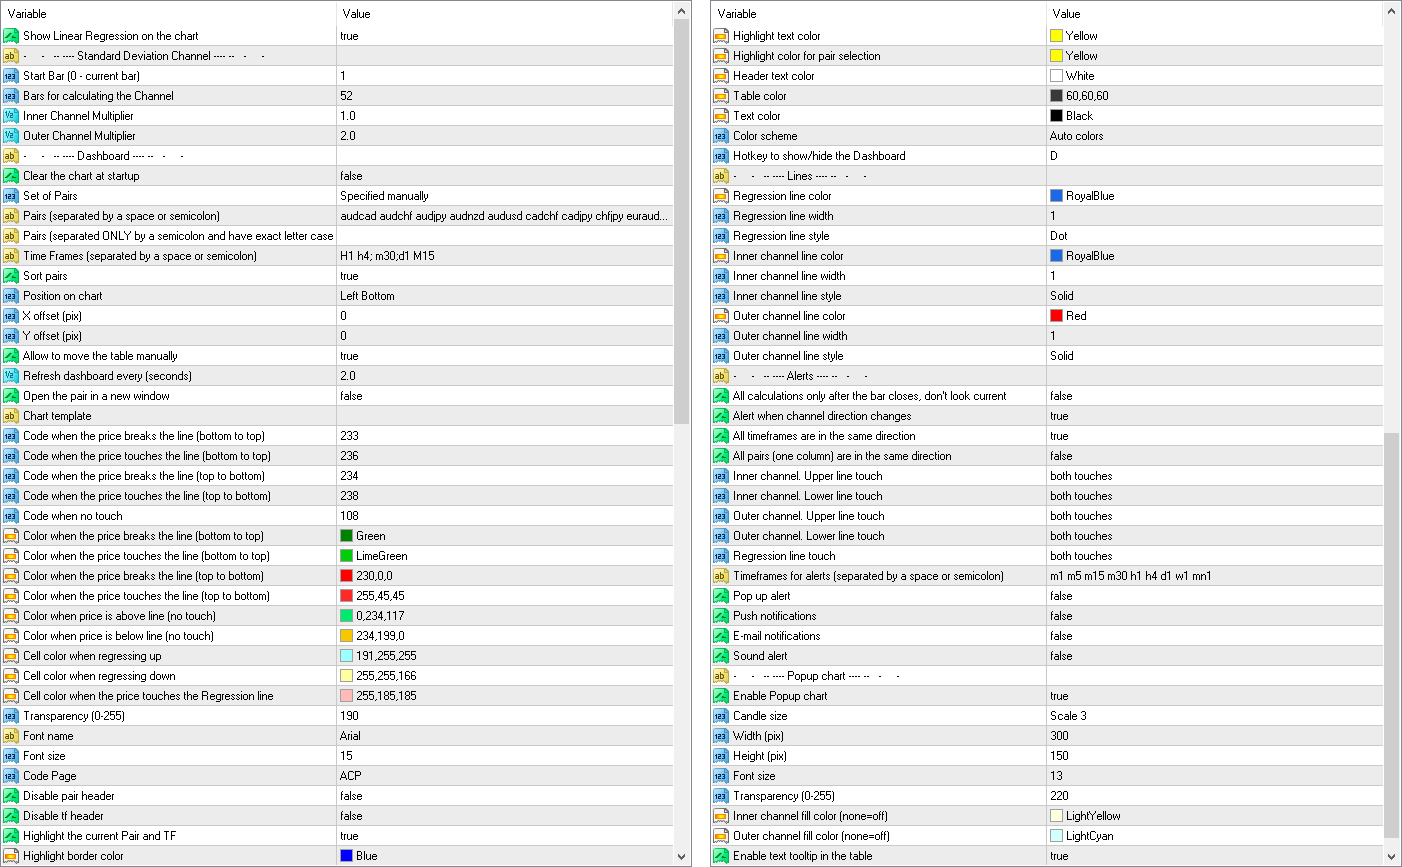
Parameters
Bars for Calculation — number of candles to calculate.
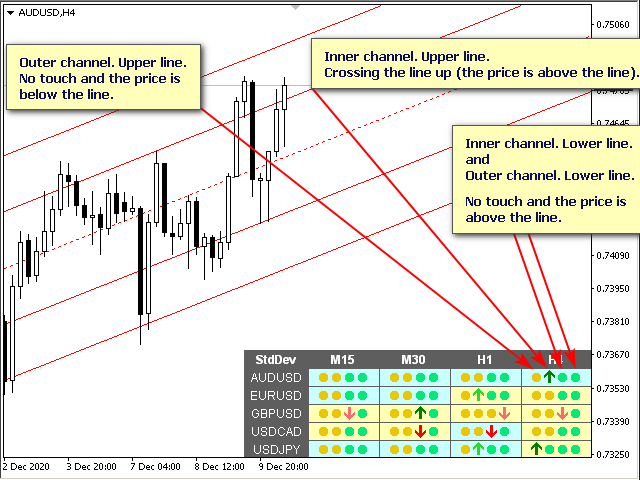
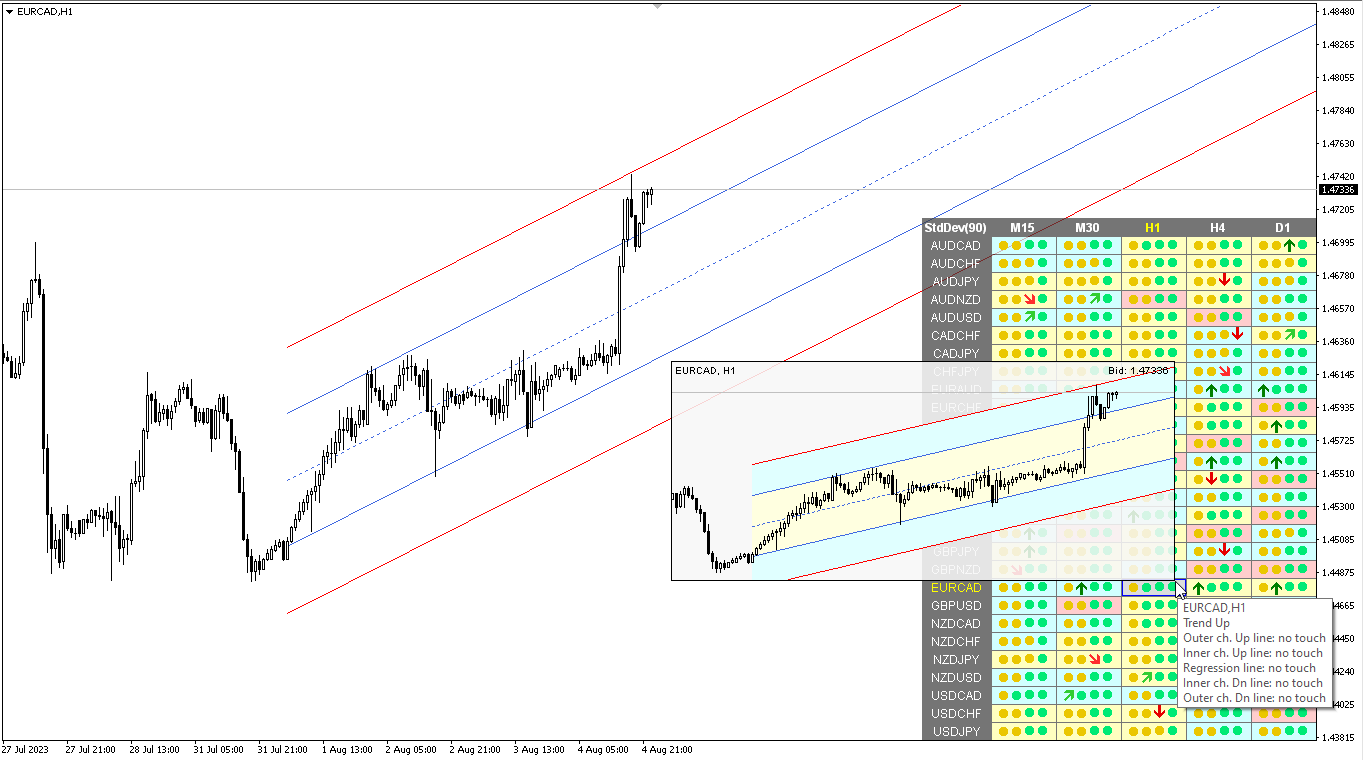
Inner Channel Multiplier — multiplier for drawing the inner channel.
Outer Channel Multiplier — multiplier for drawing the outer channel.
Set of Pairs — set of symbols
— Market Watch — pairs from the "Market Watch" of the MT;— Specified manually — pairs specified manually, in the parameters "Pairs".— Current pair — show only the current pair.
Time Frames (separated by a space or semicolon) — list of timeframes separated by spaces or semicolons (multi timeframe).
Sort pairs — sorting the list of pairs.
Position on chart — corner to display the panel on the chart.
X offset (pix) — shift the panel along the X axis;
Y offset (pix) — shift the panel along the Y axis;
Refresh dashboard every (seconds) — update period for all pairs and timeframes.
Open the pair in a new window — open a symbol in a new chart window by clicking.
Chart template — the name of the template for the chart, if the chart opens in a new window.
Code when cross from bottom to top (price above line);
Code when cross from top to bottom (price below line);
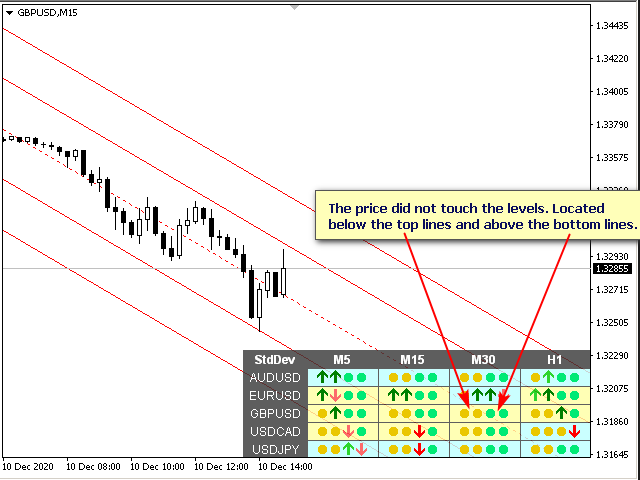
Code when no touch;
Color when cross from bottom to top (price above line);
Color when cross from top to bottom (price below line);
Color when price is above line (no touch);
Color when price is below line (no touch);
Cell color when regressing up — the color of the cell when the channel is pointing up. (maybe clrNONE);
Cell color when regressing down — the color of the cell when the channel is pointing down. (maybe clrNONE);
Transparency (0-255);
Font name;
Font size;
Alert when channel direction changes;
All timeframes are in the same direction;
All pairs (one column) are in the same direction;
Inner channel. Upper line touch;
Inner channel. Lower line touch;
Outer channel. Upper line touch;
Outer channel. Lower line touch;
Check alerts only when the candle is closed;
Timeframes for alerts (separated by a space or semicolon).
keywords: StandardDevChannel, SDC, StDC, SDC, Standard Dev Channel

Best channel type of indicator. I would recommend to anyone who likes trading with standard deviations!