Session And Kill Zone Mapper

Session And Kill Zone Mapper

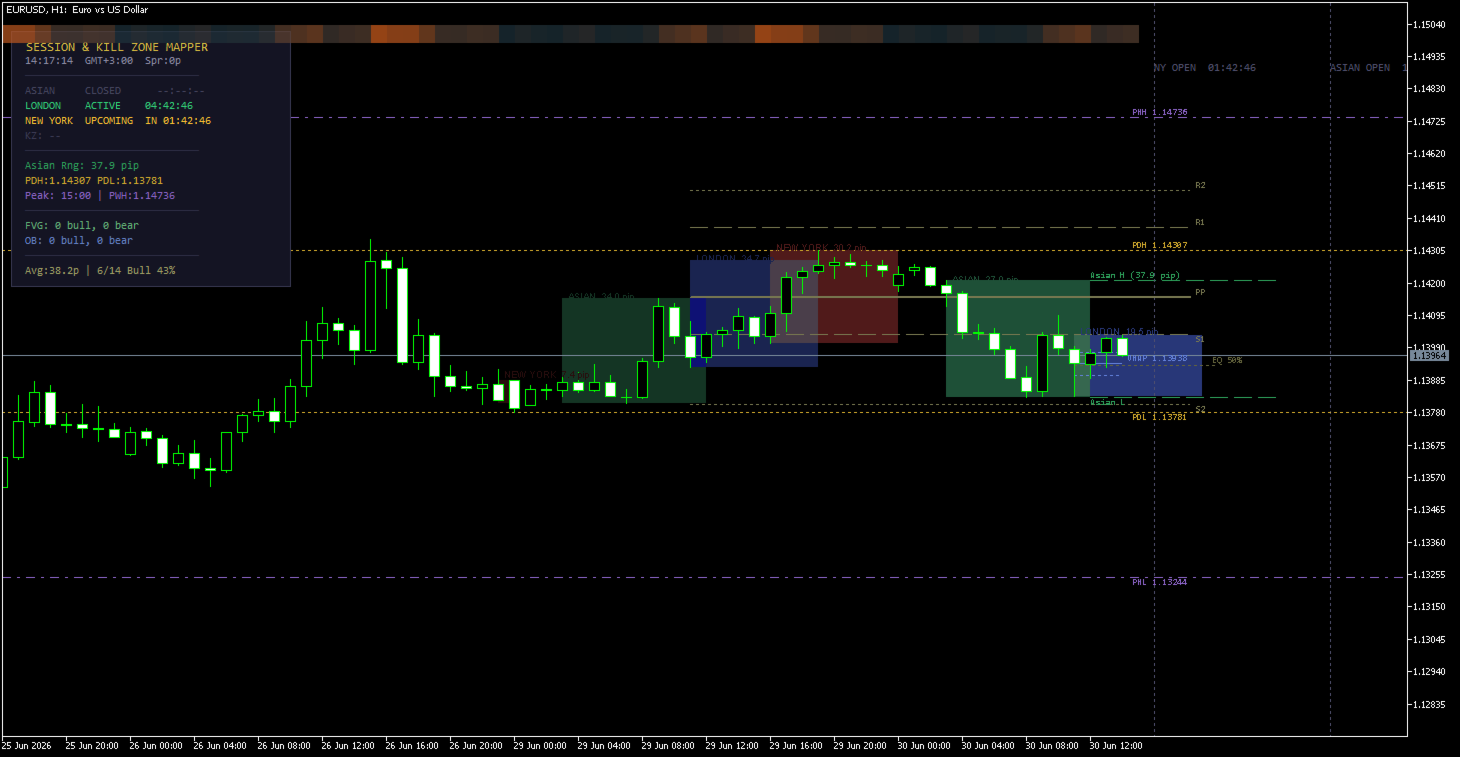
Session And Kill Zone Mapper is a session indicator for MetaTrader 5 built around the session-based framework that many intraday traders follow. It draws colored session boxes for the Asian, London, and New York sessions, each displaying its pip range and countdown timer. It marks the Asian session range and tracks price breakouts beyond it. It plots previous day, week, and month high and low levels. It calculates per-session VWAP with standard deviation bands. It identifies Fair Value Gaps and Order Blocks using Smart Money logic. It draws session pivots and premium/discount zones. It displays a 24-hour volatility heatmap across the chart background. And it presents all of this on a real-time dashboard panel with session statistics, spread, and zone status — on a single chart, without switching timeframes or opening external tools.

Session Boxes with Multi-Day History

Three session boxes are drawn for the Asian, London, and New York sessions, each displaying its high, low, and total pip range as a label inside the box. Session times are configured in GMT and automatically converted to your broker's server time. The Pro edition supports multi-day session history with configurable depth — previous days' session boxes appear with gradually fading colors so that older sessions are visually receded behind the current day. Two additional custom session slots are available for sessions such as Sydney or the London-New York overlap, each with its own name, time window, and color.

Kill Zones

Three Kill Zones are drawn as shaded vertical bands on the chart: the London Open Kill Zone, the New York Open Kill Zone, and the London Close Kill Zone. Each Kill Zone has configurable start and end times (GMT) and its own background and border color. When a Kill Zone is currently active, its border is highlighted with a thicker line. Yesterday's Kill Zones are also drawn with faded colors and a dotted border, so you can see how they related to the current day's price structure. The dashboard panel displays which Kill Zone is active at any given moment.

Asian Range with Breakout Detection

After the Asian session closes, the Asian high and low are extended forward as horizontal dashed lines. The total pip width of the Asian range is labeled on the chart. The indicator monitors subsequent price action for breakouts: when a candle closes above the Asian high, a green arrow is placed at the breakout point. When a candle closes below the Asian low, a red arrow is placed. The first breakout of each day can trigger a sound alert or popup alert, including the breakout price level in the message. Breakout detection uses the M5 close price, so only sustained moves beyond the range are flagged — not momentary wicks.

Previous Day, Week, and Month High/Low

High and low levels from three timeframes are plotted on the chart: the previous day (PDH/PDL) as dotted lines, the previous week (PWH/PWL) as dash-dot lines, and the previous month (PMH/PML) as dash-dot-dot lines. Each level pair uses a distinct line style and its own color for quick visual identification. All levels include price labels and are updated automatically at the start of each new period. The dashboard panel displays the current PDH, PDL, PWH, and PWL values alongside other session data.

Session VWAP with Standard Deviation Bands

A VWAP line is calculated for each session using tick volume and the typical price formula. Each VWAP line includes upper and lower bands based on one standard deviation of the typical price distribution around the VWAP. The VWAP updates in real time during an active session. Three separate VWAP lines are maintained simultaneously — one each for the Asian, London, and New York sessions — drawn in distinct colors so you can see how the current price relates to each session's volume-weighted average. The VWAP remains visible after a session closes.

Session Pivots and Premium/Discount

Pivot point levels (PP, R1, R2, S1, S2) are calculated from the previous day's London session high, low, and close. These levels are drawn on the chart with PP as a solid line, R1/S1 as dashed lines, and R2/S2 as dotted lines — each labeled with its level name. A 50% equilibrium line is drawn across the range of the current active major session (London or New York), dividing the range into premium territory above and discount territory below. The equilibrium level is labeled "EQ 50%" on the chart.

Fair Value Gaps and Order Blocks

The indicator scans recent M5 price data to identify Fair Value Gaps and Order Blocks. A bullish FVG is detected when the low of a candle is higher than the high of the candle two bars earlier, leaving an unfilled gap. A bearish FVG is detected in the opposite condition. Bullish Order Blocks are identified when a bearish candle is followed by a candle that closes above the bearish candle's high. Bearish Order Blocks form when a bullish candle is followed by a close below its low. Each detected zone is checked for mitigation — whether price has subsequently traded back through the zone. Unmitigated zones are drawn as colored rectangles extending forward on the chart. Mitigated zones are not drawn but are still counted. The dashboard panel displays the count of unmitigated bullish and bearish FVGs and Order Blocks separately. The lookback period and maximum number of zones are configurable.

24-Hour Volatility Heatmap

A color-coded heatmap strip is drawn across the top of the chart using the Canvas API. Each segment corresponds to an hour of the day and is colored based on the average hourly price range over the past 20 days. Cooler tones represent hours with smaller average ranges. Warmer tones highlight hours when the market historically produces more movement. The color mapping uses a power curve to increase contrast between quiet and active hours. The dashboard panel displays the peak volatility hour — the hour with the highest average range — so you can see at a glance when the market typically moves most.

Dashboard Panel

A 16-row information panel in the corner of the chart displays real-time data. The rows show the session status (Active, Upcoming, or Closed) and countdown timers for all three sessions, the currently active Kill Zone, the Asian range width in pips, PDH and PDL price levels, PWH and PWL price levels alongside the peak volatility hour, FVG counts (bullish and bearish), Order Block counts (bullish and bearish), the current spread, GMT offset, and session statistics including average pip range and directional bias. The panel updates every second and can be toggled on or off through the input settings.

Cycle Lines with Countdown

Vertical dotted lines are drawn at the next upcoming open times for each session. A countdown label is placed at the top of each line showing the session name and the remaining time until that session opens. These cycle lines update every second so the countdown is always current.

Session Statistics

The indicator calculates session statistics over a configurable number of days. For the London session, it computes the average pip range, the number of days that closed higher than they opened (up days), the number that closed lower (down days), and a directional bias expressed as a percentage. This lets you compare today's session development against recent norms — whether the current range is typical for this time of day, and whether recent sessions have tended to close in one direction.

Alerts

Five alert conditions are available and each can be enabled or disabled independently. Session open alerts trigger at the start of the Asian, London, and New York sessions. The Kill Zone alert triggers when any Kill Zone becomes active. The Asian breakout alert triggers on the first close beyond the Asian high or low for the day, including the breakout price in the message. An FVG alert triggers when a new Fair Value Gap is detected. Alert delivery methods include popup alerts and sound alerts.

Sessions. Levels. Zones. Statistics. One chart, one tool.

Getting Started

Attach the indicator to any chart and any timeframe. Session times are configured in GMT and automatically adjusted to your broker's server time through built-in GMT offset detection. All visual elements are organized into labeled input groups: session times, colors and style, Kill Zones, Asian range settings, PDH/PDL, PWH/PWL, PMH/PML, VWAP, premium/discount, pivots, Smart Money parameters, cycle lines, heatmap colors, dashboard panel options, and alert settings. The indicator works with any symbol including forex pairs, indices, and commodities.

Feature Details
Platform MetaTrader 5
Type Chart indicator (overlay, no separate window)
Symbols Any — forex, indices, commodities, crypto
Timeframes Any (Smart Money scans M5 internally)
Sessions Asian, London, New York + 2 custom sessions
Kill Zones London Open, NY Open, London Close — today + yesterday faded
Asian Range Extended levels with breakout arrows (close-based)
Key Levels PDH/PDL, PWH/PWL, PMH/PML, Session Pivots (PP, R1, R2, S1, S2)
VWAP Per-session VWAP with 1-SD upper/lower bands
Premium/Discount 50% equilibrium line on current major session
Smart Money FVG (bullish/bearish) + Order Blocks (bullish/bearish) with mitigation tracking
Heatmap 24-hour average hourly volatility — Canvas-rendered, cold-to-warm color scale
Statistics Avg pip range, up/down days, directional bias — configurable period
Dashboard 16-row real-time panel with session status, KZ, levels, FVG/OB counts, stats
Cycle Lines Session open lines with live countdown labels
Alerts Session Open, Kill Zone, Asian Breakout, FVG (Popup + Sound)
Multi-Day History Configurable depth with automatic color fading for older sessions
GMT Detection Automatic broker offset detection with fallback logic
Activations 10
Session times are configured in GMT. The indicator automatically detects your broker's GMT offset and adjusts all session boundaries accordingly. No manual time conversion is needed.

For questions, feedback, or feature requests, please use the Comments section on this product page.

Prodotti consigliati
CosmiCLab SMC FIBO CosmiCLab SMC FIBO is a professional trading indicator designed for traders who use Smart Money Concepts (SMC), market structure analysis and Fibonacci retracement levels. The indicator automatically detects market swings and builds Fibonacci levels based on the latest impulse movement. It also identifies market structure changes such as BOS (Break of Structure) and CHOCH (Change of Character), helping traders understand the current market direction. CosmiCLab SMC FIBO also pr
Una delle sequenze numeriche è chiamata "Sequenza di incendi boschivi". È stata riconosciuta come una delle nuove sequenze più belle. La sua caratteristica principale è che questa sequenza evita andamenti lineari, anche quelli più brevi. È questa proprietà che ha costituito la base di questo indicatore. Quando si analizza una serie temporale finanziaria, questo indicatore cerca di rifiutare tutte le possibili opzioni di tendenza. E solo se fallisce, riconosce la presenza di una tendenza e dà il
Vi presentiamo l' Oscillatore Heikin Ashi RSI ! Questo indicatore combina i concetti delle candele Heikin Ashi con l'RSI (Relative Strength Index) per produrre un formato simile a un oscillatore che può essere utilizzato per filtrare parte del rumore associato alle letture standard dell'RSI. Questo fornisce ai trader una rappresentazione più fluida delle condizioni di mercato. Ecco alcuni articoli per saperne di più sull'RSI e sulle candele Heikin Ashi: https://www.investopedia.com/terms/r/rsi.a
Caicai L&S Yield Histogram Important Notice: This indicator is an integral tool of the automated EA Caicai Long and Short Pair Trading . This indicator visually displays the percentage deviation (Yield %) of a pair's current spread relative to its own historical mean. It is an excellent tool for quickly visualizing the gross financial potential of a market distortion in Long & Short operations. Main Features: Percentage Visualization: Understand the size of the distortion in palpable percentage
L'indicateur SMC Venom Model BPR est un outil professionnel pour les traders travaillant dans le concept Smart Money (SMC). Il identifie automatiquement deux modèles clés sur le graphique des prix: FVG   (Fair Value Gap) est une combinaison de trois bougies, dans laquelle il y a un écart entre la première et la troisième bougie. Forme une zone entre les niveaux où il n'y a pas de support de volume, ce qui conduit souvent à une correction des prix. BPR   (Balanced Price Range) est une combinaiso
Pro Gold System Indicator
PEDRO JOAQUIM GONCALVES GOMES
ADVANCED FUNCTIONALITIES: Trend Score (0-100) with visual bar Intelligent signals with adjustable strength (1-10) Risk management with automatic TP/SL Audible and visual alerts Price zones with smooth filling Multi-indicator analysis (RSI, ATR, BB, EMAs) DESIGN FEATURES Modern Visual: Smooth and well-spaced lines (EMA with 2-3px width) Vibrant and professional colors (Sky Blue, Orange, Gold) Modern arrows (code 233/234) for buy/sell signals Configurable dark/light theme Adjustable transparency f
Fibo Channels
Jeffrey Quiatchon
Fibo Daily Channel Indicator The  Indicator is a powerful tool for traders, providing precise daily support and resistance levels based on Fibonacci retracement and extension calculations. This indicator automatically draws key pivot points (PP, R1, R2, S1, S2) as well as additional extension levels (R3, R4, S3, S4), helping traders identify potential reversal and breakout zones with ease. It includes customizable alerts and push notifications, allowing traders to receive updates whenever the pr
ZigZag Trend Lines — See the Trend with Professional Clarity ZigZag Trend Lines was developed for traders who want to read the market objectively, eliminating noise and focusing only on what really matters: the trend structure. Based on the renowned ZigZag indicator, it goes beyond the basics and delivers a clean, intuitive, and highly adjustable visual reading — ideal for scalpers, day traders, and swing traders alike. Key Features Automatic Trend Lines The indicator identifies and plot
Visual Dolphin Indicator
AL MOOSAWI ABDULLAH JAFFER BAQER
Visual Dolphin Indicator Unlock the rhythm of the market with the Visual Dolphin Indicator, your ultimate tool for identifying and capitalizing on market trends with clarity and confidence. Designed for both novice and experienced traders, this indicator eliminates the noise and guesswork, providing crystal-clear buy and sell signals directly on your chart. The Logic Behind the Waves The core of the Visual Dolphin Indicator is a sophisticated yet intuitive dual-wave system based on moving avera
LT Rainbow Trend
Thiago Duarte
5 (1)
== LT RAINBOW TREND - L'INDICATORE DI TREND CON 36 MEDIE MOBILI == PANORAMICA Il LT Rainbow Trend è un indicatore tecnico avanzato per l'analisi dei trend che utilizza 36 Medie Mobili simultanee gestite da un sistema di colori intelligente (Rainbow). Sviluppato per i trader che desiderano operare nella direzione del trend principale con la massima chiarezza visiva, l'indicatore trasforma la complessità dell'analisi multi-timeframe in una visualizzazione semplice, colorata e altamente intuitiva
Save your time . Select area and the trend line will draw automatically . Draw a support and resistance line for the selected range with two mouse clicks .  If you need to, you can also draw a line for support and resistance based on separate areas. The resistance trend line is drawn based on the first and last highs inside the selected area; The support trend line is drawn based on first and last lows inside the selected area;
Indicatore Crypto_Forex Pattern PINBAR per MT5, senza ridisegnare, senza ritardi. - L'indicatore "PINBAR Pattern" è un indicatore molto potente per il trading basato sull'azione dei prezzi. - L'indicatore rileva le PinBar sul grafico: - PinBar rialzista - Segnale a freccia blu sul grafico (vedi immagini). - PinBar ribassista - Segnale a freccia rossa sul grafico (vedi immagini). -   Con avvisi su PC e dispositivi mobili. - L'indicatore "PINBAR Pattern" è eccellente da combinare con i livelli d
Gann Box MT5
Frederic Jacques Collomb
L'indicatore Gann Box è uno strumento potente e versatile progettato per aiutare i trader a identificare e sfruttare i livelli chiave del mercato. Questo indicatore consente di disegnare un rettangolo sul grafico, che viene automaticamente suddiviso in più zone con livelli strategici 0, 0.25, 0.50, 0.75, 1 . Quando il prezzo tocca uno di questi livelli, si attivano degli avvisi, offrendo così un aiuto prezioso per le decisioni di trading. Sapete immediatamente come si sta evolvendo il mercato ri
Stochastic MTF Dashboard
Andres Felipe Carvajal Rodriguez
4.67 (3)
Stochastic MTF Dashboard Lo Stochastic MTF Dashboard è una soluzione visiva progettata per massimizzare l'efficienza operativa. Ti permette di monitorare lo stato dell'oscillatore stocastico su un massimo di 6 diversi intervalli temporali (timeframe) simultaneamente, il tutto senza dover cambiare il grafico corrente. Il suo obiettivo è eliminare la confusione e offrirti una lettura istantanea della forza del mercato: Rosso: Zona di Ipercomprato: Possibile esaurimento del prezzo (Opportunità di v
FREE
MeeKiew Semafor + SuperTrend MeeKiew Semafor + SuperTrend  is a streamlined technical tool designed to combine high-probability structural analysis with robust momentum tracking. By integrating a   clutter-free, Single-Level Semafor engine   with a dynamic volatility-based trend filter (SuperTrend), this indicator eliminates market noise and provides traders with crystal-clear, actionable execution zones. 1. The Streamlined Semafor Engine (Clean Market Structure) Pure Peak & Trough Detecti
FREE
Probability Candle v1
Teresinha Moraes Correia
L’indicatore fornisce segnali attraverso calcoli di probabilità. Legge il contesto della giornata in base agli orari di inizio e di fine impostati dall’utente per la raccolta dei dati e l’emissione dei segnali. In determinati momenti conferma il segnale con un simbolo sopra o sotto la candela, indicando che il segnale può essere ancora più forte grazie ai cambiamenti in tempo reale al momento dell’emissione. Il segnale testuale situato nell’angolo superiore destro mostra la forza del
ZT Scalper Bundle 1
Damien Joseph Marie Juge
This Bundle offers an all-in-one tools for scalpers. Basic but effective. Powerfull together. Namely Breakout detector with pivot or ohlc and a colored MA to check the trend. --------------- It includes :  - Pivot levels with different parameters - Colored MA, to visualize trends and reversals - OHLC, to keep an eye on daily key levels. - BreakOut detector, to take advantage of breakouts on all UT and take the trend.
"Hunttern harmonic pattern finder" base on the dynamic zigzag with the notification and prediction mode This version of the indicator identifies 11 harmonic patterns and predicts them in real-time before they are completely formed. It offers the ability to calculate the error rate of Zigzag patterns depending on a risk threshold. It moreover sends out a notification once the pattern is complete. The supported patterns: ABCD BAT ALT BAT BUTTERFLY GARTLEY CRAB DEEP CRAB CYPHER SHARK THREE DRIV
OFFERTA ESCLUSIVA DI LANCIO !!! Dopo l'acquisto, contattami tramite la casella di posta di MQL5 per ricevere GRATUITAMENTE il mio redditizio indicatore Top Bottom. Manuali per aiutarti a comprendere il funzionamento dell'indicatore e la logica alla base degli Smart Money Concepts. Impostazioni manuali dell'indicatore   //   Come utilizzare SMC Smart Market Concepts - Indicatore SMC “tutto in uno” per MT4/MT5: struttura, OB, FVG, zone, sessioni, Fib/OTE e avvisi.   //   Versione MT4 Ques
Trade history
Andriy Konovalov
5 (2)
The indicator plots charts of profit taken at the Close of candles for closed (or partially closed) long and short positions individually. The indicator allows to filter deals by the current symbol, specified expert ID (magic number) and the presence (absence) of a substring in a deal comment, to set the start time and the periodicity of profit reset (daily, weekly or monthly) to calculate the profit chart. The indicator also displays the floating (not fixed) profit of the opened positions at th
RBreaker
Zhong Long Wu
RBreaker Gold Indicators is a short-term intraday trading strategy for gold futures that combines trend following and intraday reversal approaches. It not only captures profits during trending markets but also enables timely profit-taking and counter-trend trading during market reversals. This strategy has been ranked among the top ten most profitable trading strategies by the American magazine   Futures Truth   for 15 consecutive years. It boasts a long lifecycle and remains widely used and st
============== -- If you are a fan of FIBONACCI... then this is defenitely a tool for you -- Please master the optimal trade entry concept and you will become profitable -- Show me you comment about this tool and I will give you more tools: Tradelist Panel, Watermark, Reversal tool, ... ============== Hallo Trader, This is fibonacci system based on the previous day levels (low and high) and the current day levels. You can choose your favorite in settings. I use the Previous Day Fibo and use the
FREE
Advanced MT5 Indicator: Precision-Powered with Pivot Points, MAs & Multi-Timeframe Logic Unlock the full potential of your trading strategy with this precision-engineered MetaTrader 5 indicator —an advanced tool that intelligently blends Pivot Points , Adaptive Moving Averages , and Multi-Timeframe Analysis to generate real-time Buy and Sell signals with high accuracy.    If you want to test on Real Market, Let me know. I will give the Demo file to run on Real Account.    Whether you're a scal
Multi-Timeframe S&R Multi-Timeframe S&R is a technical analysis indicator that detects pivot points across multiple timeframes and displays price levels where these points cluster on the chart. It integrates data from M15 up to Monthly timeframes for its analysis. Functional Overview Multi-Timeframe Clustering Aggregates pivot points from specified timeframes and merges them into a single level if they fall within a defined tolerance range. Magnet Function Automatically adjusts detected price l
FREE
News Dashboard Pro
Beatrice Bernard Mgaya
2 (1)
Certainly! Let me provide descriptions for the News Filter tools available on both MetaTrader 4 (MT4) and MetaTrader 5 (MT5) platforms: News Filter for MT4 : Description : The News Filter for MT4 is an expert advisor (EA) template that allows traders to manage their positions during news events. It downloads news data from investing.com without using any external DLLs (Dynamic Link Libraries). Traders can customize their actions based on news releases. Features : Automatic News Detection : The
Force Trade X MT5 is an EA based on Force Index. Force Index parameters such as Period, BuyShift, BuyValue, SellShift, and SellValue can be adjusted. Force Trade X MT5 applies BTN TECHNOLOGY's state-of-the-art intelligent technology to help you create optimal results for your trades. May your dreams come true through Force Trade X MT5. Good luck. === Inquiries === E-Mail:support@btntechfx.com
HAS RSI Signal — Indicatore di Tendenza Professionale con Calcolo SL/TP HAS RSI Signal è un potente strumento di trading che combina classici intramontabili con moderni algoritmi di filtraggio del rumore. L'indicatore analizza il mercato attraverso le candele Heiken Ashi Smoothed (HAS) e l'oscillatore RSI , fornendo al trader segnali di ingresso chiari durante le inversioni di tendenza o l'uscita dalle zone di ipercomprato/ipervenduto. Vantaggi Principali: Doppio Filtraggio: L'uso di Heiken Ashi
BREAK RETEST NON-REPAINT. WORKS BEST AT M15 AND ABOVE.  Benefits Fewer false breakouts . Combining close confirmation + retest + previous-close filter greatly reduces noise vs. raw high/low breaks. Tighter execution plans . The drawn level line gives an objective spot for entries, stop placement (just beyond the level), and partial-take-profit structure. Non-repainting confidence . Signals are placed on current bar. Flexible across markets . Works on FX, indices, metals, crypto; scalping on M15
Visual CrossPulse Dynamics Indicator
AL MOOSAWI ABDULLAH JAFFER BAQER
Visual CrossPulse Dynamics: Trade with the Market's True Rhythm Unlock a new level of market insight with Visual CrossPulse Dynamics, a sophisticated trading indicator designed to adapt to ever-changing volatility and reveal the true direction of the trend. Are you tired of indicators that lag in fast-moving markets or give false signals during consolidation? The Visual CrossPulse Dynamics indicator solves this problem by using an advanced, adaptive algorithm that intelligently adjusts to the m
Price Magnet — Price Density and Attraction Levels Indicator Price Magnet is a professional analytical tool designed to identify key support and resistance levels based on statistical Price Density. The indicator analyzes a specified historical period and detects price levels where the market spent the most time. These zones act as “magnets,” attracting price action or forming a structural base for potential reversals. Unlike traditional Volume Profile tools, Price Magnet focuses on price-time d
Gli utenti di questo prodotto hanno anche acquistato
Neuro Poseidon MT5
Daria Rezueva
4.79 (53)
Neuro Poseidon is a new indicator by Daria Rezueva. It combines precise trading signals with adaptive TP/SL levels - creating best possible trades as a result! Message me and get  Neuro Poseidon Assistant  as a gift to automize your trading process! What makes it stand out? 1. Proven profitability on all assets and timeframes 2. Only confirmed BUY and SELL signals present on the chart 3. Adaptive TP & SL levels generated by the software for each trade 4. Easy to understand - suitable for al
SuperScalp Pro
Van Minh Nguyen
4.68 (28)
SuperScalp Pro –  Sistema Professionale di Scalping con Confluenza Multilivello SuperScalp Pro è un sistema di trading professionale a confluence multi-livello progettato per identificare opportunità di trading ad alta probabilità attraverso una conferma intelligente multi-fattoriale. Integrando Supertrend, VWAP, EMA, RSI, ADX, analisi dei volumi, Bande di Bollinger e divergenza MACD, il sistema filtra le configurazioni di bassa qualità, riduce i falsi segnali di breakout e migliora la precision
M1 Quantum MT5
Hamed Dehgani
5 (5)
Segnali di Trading Live con M1 Quantum: Segnale Piano prezzi: Prezzo attuale: $149 (Offerta per i primi utenti) Prossimo prezzo previsto: $169 Prezzo al dettaglio previsto: $299 Nota dello sviluppatore: Dopo l’acquisto, contattami per ricevere il file di configurazione più recente (Set File) , consigli operativi e l’invito al gruppo VIP di supporto , dove potrai interagire con altri utenti di M1 Quantum. M1 Quantum è un sistema di trading p rofessionale per M1 che fornisce segnali di trading ra
Cominciamo con la verità. Nessun indicatore da solo ti renderà profittevole. Se qualcuno ti dice il contrario, ti sta vendendo un sogno. Qualsiasi indicatore che mostra frecce perfette di acquisto/vendita può essere reso impeccabile — basta ingrandire la giusta sezione della storia e catturare solo i trade vincenti. Noi non lo facciamo.  SMC Intraday Formula è uno strumento. Legge la struttura del mercato per te, identifica le zone a più alta probabilità e ti mostra esattamente come appare la t
Entry In The Zone and SMC Multi Timeframe is a real-time 2-in-1 market analysis tool that combines market structure analysis and a No Repaint BUY / SELL signal system into a single indicator, built on Smart Money Concepts (SMC) — a widely adopted framework used by professional traders to understand market structure. This indicator helps you see the market more clearly, make decisions based on structure rather than guesswork, and focus on high-probability zones where price is more likely to react
Divergence Bomber
Ihor Otkydach
4.9 (92)
Ogni acquirente dell’indicatore riceverà inoltre gratuitamente: L’utilità esclusiva “Bomber Utility”, che gestisce automaticamente ogni operazione, imposta i livelli di Stop Loss e Take Profit e chiude le posizioni secondo le regole della strategia I file di configurazione (set file) per adattare l’indicatore a diversi asset I set file per configurare il Bomber Utility in tre modalità: “Rischio Minimo”, “Rischio Bilanciato” e “Strategia di Attesa” Una guida video passo-passo per installare, conf
Questo prodotto è stato aggiornato per il mercato 2026 e ottimizzato per le ultime build di MT5. AVVISO DI AGGIORNAMENTO PREZZO: Smart Trend Trading System è attualmente disponibile a $99 . Il prezzo aumenterà a $199 dopo i prossimi 30 acquisti . OFFERTA SPECIALE: Dopo aver acquistato Smart Trend Trading System, inviami un messaggio privato per ricevere Smart Universal EA GRATIS e trasformare i tuoi segnali Smart Trend in operazioni automatiche. Smart Trend Trading System è un sistema di tradin
L'indicatore UZFX {SSS} Scalping Smart Signals v4.0 MT5 è un indicatore di trading ad alte prestazioni che non subisce ripaint, progettato per scalper, day trader e swing trader che necessitano di segnali accurati e in tempo reale in mercati in rapida evoluzione. Sviluppato da (UZFX-LABS), questo indicatore combina l’analisi dell’azione dei prezzi, la conferma del trend e il filtraggio intelligente per generare segnali di acquisto e vendita ad alta probabilità, segnali di allerta e opportunità d
L’indicatore evidenzia le zone in cui viene dichiarato interesse sul mercato , per poi mostrare la zona di accumulo degli ordini . Funziona come un book degli ordini su larga scala . Questo è l’indicatore per i grandi capitali . Le sue prestazioni sono eccezionali. Qualsiasi interesse ci sia nel mercato, lo vedrai chiaramente . (Questa è una versione completamente riscritta e automatizzata – non è più necessaria un’analisi manuale.) La velocità di transazione è un indicatore concettualmente nuo
Power Candles MT5
Daniel Stein
5 (8)
Power Candles V3 - Indicatore di forza ad ottimizzazione automatica Power Candles V3 trasforma la forza delle valute e degli strumenti in un piano di trading attuabile su ogni grafico a cui è collegato. Invece di limitarsi a colorare le candele, esegue un'auto-ottimizzazione in tempo reale in background e ti fornisce i migliori valori di Stop Loss, Take Profit e soglia di segnale per il simbolo che hai davanti. Basta un clic per adottarlo nel trading live: i raggi di ingresso, Stop Loss e Take P
Trend Sniper X
Sarvarbek Abduvoxobov
5 (2)
Trend Sniper X è un indicatore di trend following multi-timeframe per MetaTrader 5 che aiuta i trader a identificare la direzione del trend e i potenziali punti di inversione con chiarezza e precisione. Informazioni sul prezzo: Il prezzo attuale è promozionale ed è soggetto a modifiche con il rilascio di futuri aggiornamenti e nuove funzionalità. Canale Code2Profit   Domina il mercato con l'analisi multi-timeframe!   Trend Sniper X: Analisi sistematica del mercato e aggiornamenti   Specifiche te
Gann Made Easy è un sistema di trading Forex professionale e facile da usare che si basa sui migliori principi del trading utilizzando la teoria di mr. WD Gann. L'indicatore fornisce segnali ACQUISTA e VENDI accurati, inclusi i livelli di Stop Loss e Take Profit. Puoi fare trading anche in movimento utilizzando le notifiche PUSH. CONTATTAMI DOPO L'ACQUISTO PER RICEVERE GRATUITAMENTE LE ISTRUZIONI DI TRADING E OTTIMI INDICATORI EXTRA! Probabilmente hai già sentito parlare molte volte dei metodi d
Gem SIGNAL
Shengzu Zhong
5 (1)
GEM Signal Pro GEM Signal Pro è un indicatore trend-following per MetaTrader 5, progettato per i trader che desiderano segnali più chiari, configurazioni operative più strutturate e una gestione del rischio più pratica direttamente sul grafico. Invece di mostrare solo una semplice freccia, GEM Signal Pro aiuta a presentare l’intera idea di trading in modo più chiaro e leggibile. Quando le condizioni sono confermate, l’indicatore può mostrare sul grafico il prezzo di ingresso, lo stop loss e gli
Atomic Analyst MT5
Issam Kassas
4.33 (39)
Questo prodotto è stato aggiornato per il mercato 2026 e ottimizzato per le ultime build di MT5. AVVISO DI AGGIORNAMENTO PREZZO: Atomic Analyst è attualmente disponibile a $99 . Il prezzo aumenterà a $199 dopo i prossimi 30 acquisti . OFFERTA SPECIALE: Dopo aver acquistato Atomic Analyst, inviami un messaggio privato per ricevere Smart Universal EA GRATIS e trasformare i tuoi segnali Atomic Analyst in operazioni automatiche. Atomic Analyst è un indicatore di trading Price Action non-repainting
The Oracle Pro
Ottaviano De Cicco
The Oracle Pro: Synthetic Multi-Timeframe Bias Engine for MT5 ️ Summer Launch Offer — Get The Oracle Pro for USD 199 (early buyers). Price rises with traction; final price USD 399. The Oracle Pro is a premium multi-timeframe bias engine for MetaTrader 5, built for demanding and professional traders. It answers one question with discipline: what is the directional bias on each timeframe right now, how strong is it, and how much do the timeframes agree? Everything is computed on closed bars only
Axiom Matrix
Issam Kassas
5 (1)
AXIOM MATRIX MT5 PREZZO DI LANCIO: $99 Axiom Matrix è disponibile al prezzo di lancio di $99. Il prezzo aumenterà a $199 dopo i primi 30 acquisti. Axiom Matrix è uno scanner di mercato professionale multi-simbolo e multi-timeframe, oltre a un pannello decisionale per MetaTrader 5. Scansiona il tuo Market Watch, analizza più timeframe, legge più motori di evidenza, confronta le opportunità più forti e ti mostra la migliore condizione BUY, SELL, WAIT o bloccata all’interno di un’unica dashboard a
ARIPoint
Temirlan Kdyrkhan
1 (1)
ARIPoint is a powerful trading companion designed to generate high-probability entry signals with dynamic TP/SL/DP levels based on volatility. Built-in performance tracking shows win/loss stats, PP1/PP2 hits, and success rates all updated live. Key Features: Buy/Sell signals with adaptive volatility bands Real-time TP/SL/DP levels based on ATR Built-in MA Filter with optional ATR/StdDev volatility Performance stats panel (Success, Profit/Loss, PP1/PP2) Alerts via popup, sound, push, or email Cu
Trend Forecaster
Alexey Minkov
5 (8)
Trend Forecaster is a MetaTrader 5 indicator that combines breakout signals, possible reversal area analysis, market range data and a visual statistics panel in one chart workspace. It shows Buy and Sell signals, tracks Average Range and Current Range, and can automatically adjust Sensitivity for the current symbol and timeframe. Manual Sensitivity control is also available. The indicator can be used on Forex pairs, metals, stocks, indices and cryptocurrencies. Different timeframes are supported
Quantum TrendPulse
Bogdan Ion Puscasu
5 (25)
Ecco   Quantum TrendPulse   , lo strumento di trading definitivo che combina la potenza di   SuperTrend   ,   RSI   e   Stocastico   in un unico indicatore completo per massimizzare il tuo potenziale di trading. Progettato per i trader che cercano precisione ed efficienza, questo indicatore ti aiuta a identificare con sicurezza le tendenze di mercato, i cambiamenti di momentum e i punti di entrata e uscita ottimali. Caratteristiche principali: Integrazione SuperTrend:   segui facilmente l'andame
Current event:  https://c.mql5.com/1/326/A2SR2025_NoMusic.gif A2SR per MT5 Indicatore: Domanda e Offerta Effettive Automatizzate (S/R). + Strumenti di Trading. Product description in English here. --   Guidance   : -- at   https://www.mql5.com/en/blogs/post/734748/page4#comment_16532516 -- and  https://www.mql5.com/en/users/yohana/blog Potente, Autentico e Risparmio di Tempo per Decisioni di Trading più Intelligenti + Oggetti compatibili con EA. Vantaggi Principali Livelli di SR Effettivi
Crystal Heikin Ashi Signals
Muhammad Jawad Shabir
5 (2)
Crystal Heikin Ashi Signals - Professional Trend & Signal Detection Indicator Advanced Heikin Ashi Visualization with Intelligent Signal System for Manual & Automated Trading Final Price: $149 ---------> Price goes up $10 after every 10 sales . Limited slots available — act fast . Overview Crystal Heikin Ashi Signals is a professional-grade MetaTrader 5 indicator that combines pure Heikin Ashi candle visualization with an advanced momentum-shift detection system. Designed for both manual traders
Azimuth Pro
Ottaviano De Cicco
5 (7)
Azimuth Pro V2: Synthetic Fractal Structure and Confirmed Entries for MT5 Overview Azimuth Pro is a multi-level swing structure indicator by Merkava Labs . Four nested swing layers, swing-anchored VWAP, ABC pattern detection, three-timeframe structural filtering, and closed-bar confirmed entries — one chart, one workflow from micro-swings to macro-cycles. This is not a blind signal product. It is a structure-first workflow for traders who care about location, context, and timing. ️ Summer Sale
FX Power MT5 NG
Daniel Stein
5 (33)
FX Power: Analizza la Forza delle Valute per Decisioni di Trading Più Intelligenti Panoramica FX Power è lo strumento essenziale per comprendere la reale forza delle principali valute e dell'oro in qualsiasi condizione di mercato. Identificando le valute forti da comprare e quelle deboli da vendere, FX Power semplifica le decisioni di trading e rivela opportunità ad alta probabilità. Che tu segua le tendenze o anticipi inversioni utilizzando valori estremi di Delta, questo strumento si adatta
Btmm state engine pro
Garry James Goodchild
5 (5)
BTMM State Engine Pro is a MetaTrader 5 indicator for traders who use the Beat The Market Maker approach: Asian session context, kill zone timing, level progression, peak formation detection, and a multi-pair scanner from a single chart. It combines cycle state logic with a built-in scanner dashboard so you do not need the same tool on many charts at once. What it does Draws the Asian session range; session times can follow broker server offset or be set in inputs. Tracks level progression (L
GoldenX Entry MT5
Kareem Abbas
5 (13)
GoldenX Entry è un indicatore per MT5 con un algoritmo adattivo Smart Entry Trend, un sistema di scoring dei segnali, un rilevatore del regime di mercato e un filtro di volatilità. Ogni segnale include un livello di ingresso calcolato, tre livelli di Take-Profit (TP1, TP2, TP3) e un livello di Stop-Loss. È costruito su più livelli analitici progettati per adattarsi a diverse condizioni di mercato, combinando un sistema analitico multilivello con un ottimizzatore integrato e un sistema di traccia
Quant Direction MT5
Georgios Kalomoiropoulos
Quant Direction è uno strumento di analisi di mercato 3D. Offre un'analisi di mercato perfettamente oggettiva, basata su algoritmi, calcolando con precisione le deviazioni percentuali su diversi parametri. Sviluppato utilizzando strumenti di modellazione avanzati basati sull'intelligenza artificiale e rigorosamente testato, questo algoritmo analizza il mercato con una precisione senza pari. È possibile analizzare qualsiasi coppia di valute o strumento finanziario sulla piattaforma. Che si pratic
FX Trend MT5 NG
Daniel Stein
5 (6)
FX Trend NG: La Nuova Generazione di Intelligenza di Trend Multi-Mercato Panoramica FX Trend NG è uno strumento professionale di analisi del trend multi-timeframe e monitoraggio dei mercati. Ti consente di comprendere la struttura completa del mercato in pochi secondi. Invece di passare tra numerosi grafici, puoi identificare immediatamente quali strumenti sono in trend, dove il momentum sta diminuendo e dove esiste un forte allineamento tra i timeframe. Offerta di Lancio – Ottieni FX Trend NG
Presentazione       Quantum Breakout PRO   , l'innovativo indicatore MQL5 che sta trasformando il modo in cui scambi le zone di breakout! Sviluppato da un team di trader esperti con un'esperienza di trading di oltre 13 anni,       Quantum Breakout PRO       è progettato per spingere il tuo viaggio di trading a nuovi livelli con la sua strategia innovativa e dinamica della zona di breakout. Quantum Breakout Indicator ti fornirà frecce di segnalazione sulle zone di breakout con 5 zone target di
Reversion King Indicator
Eugen-alexandru Zibileanu
5 (5)
Un nuovo Re in città - Indicatore + Gestione ordini (TP1 + TP2 + TP3) + Invio opzionale di segnali Telegram INCLUSO (GRATIS) (SISTEMA COMPLETO DI TRADING e SEGNALI) Il nostro miglior EA per l’Oro: Gold Slayer Questo indicatore include una strategia avanzata, un sistema di trading con gestione ordini personalizzabile e un sistema mean reversion che combina estensioni di envelope, supportato da molteplici filtri intelligenti di conferma come RSI per individuare ingressi di inversione ad alta proba
Questo prodotto è stato aggiornato per il mercato 2026 e ottimizzato per le ultime build di MT5. AVVISO DI AGGIORNAMENTO PREZZO: Smart Price Action Concepts è attualmente disponibile a $200 . Il prezzo aumenterà a $299 dopo i prossimi 30 acquisti . OFFERTA SPECIALE: Dopo l’acquisto, inviami un messaggio privato per ricevere un bonus gratuito + regalo . Prima di tutto, vale la pena sottolineare che questo strumento di trading è un indicatore non-repainting, non-redrawing e non-lagging, il che lo
Altri dall’autore
Manual position management. Missing SL. Price moves against you. No protection. Trade Manager Lite automates Stop Loss, Take Profit, Trailing Stop, and Break-Even for your open positions. Attach to one chart. Configure your default SL/TP distance. Let it manage your positions automatically. What's Included (FREE Version) Auto SL/TP: Applies missing Stop Loss and Take Profit to positions based on your configured distance in points Trailing Stop: Adjusts SL dynamically as price moves in your favor
FREE
Trade Command Center
Nguyen Thanh Trieu
5 (2)
Materiali e istruzioni aggiuntive Istruzioni per l'installazione - Istruzioni per l'applicazione - Versione di prova dell'applicazione per un conto demo Conto finanziato. Un lotto calcolato male. Limite di drawdown superato. Conto chiuso. Non perche la strategia ha fallito. Perche il rischio non e stato applicato al momento dell'esecuzione. Trade Command Center e un pannello visuale di esecuzione trade e gestione del rischio. Calcola il lotto dalla distanza SL. Gestisce le posizioni automatic
SMC Liquidity Channel Guard
Nguyen Thanh Trieu
5 (2)
SMC Liquidity Channel Guard Prices reverse just as your breakout trade triggers. Account suffers unexpected drawdown. Because standard channels ignore institutional liquidity sweeps and trap retail stop-loss orders. This utility automatically monitors highest buy-side and lowest sell-side liquidity pools to flag false breakouts. Key Features: Dynamic Liquidity Tracking: Maps Buy-Side (BSL) and Sell-Side (SSL) boundaries without lagging moving averages. Sweep Identification: Prints precise direct
FREE
Perdi operazioni non per la tua strategia, ma per il tuo tempismo Pensa alle tue ultime 10 operazioni in perdita. Quante di queste hai perso perché sei entrato nel momento sbagliato — proprio quando il mercato si stava comprimendo, muovendosi lateralmente, o aveva già esaurito il suo movimento? La maggior parte dei trader ha una strategia decente. Leggono bene i grafici. Capiscono supporti e resistenze. Ma continuano a perdere perché applicano la stessa strategia in ogni condizione di mercato —
FREE
Morvan
Nguyen Thanh Trieu
MORVAN Sono Morvan. Leggo la direzione. Aspetto la struttura. Colpisco solo quando il prezzo raggiunge il livello dove il movimento ha la maggiore probabilita di svilupparsi. Nessuna supposizione. Nessun trade di vendetta. Nessun inseguimento di candele nel rumore. Eseguo solo quando la struttura si allinea — e gestisco ogni posizione dall'ingresso all'uscita con disciplina. La maggior parte dei trader non perde perche non sa leggere un grafico. Perdono perche entrano troppo tardi, dimensionano
Volume Pressure Meter breakdown tick volume to reveal the buying and selling pressure inside every candle. Unlike standard volume which only shows total activity, this indicator splits volume to show who is actually in control of the market. It helps you identify trend strength and spot potential reversals through volume divergence. Key Features: Pressure Gauge: Visual bar showing real-time Buy vs Sell percentages. Trend Bias: Automatically identifies if the market is dominated by Buyers or Sell
FREE
Smart Session Box Displays Asia, London, and New York trading sessions with automatic timezone adjustment and session overlap highlighting. Main Features Complete session analysis with no limitations. Key Features The indicator draws session boxes with high and low lines for each trading session. Session overlaps are highlighted with distinct colors to identify high liquidity periods. Breakout alerts notify when price crosses previous session levels. A control panel provides quick toggles for al
FREE
Confluence Bias Map Analyzing multiple indicators across different timeframes often leads to conflicting signals, causing traders to enter too late or hesitate during critical market moves. This inconsistency occurs because individual tools like moving averages, oscillators, and volume meters are monitored in isolation, lacking a unified perspective. Confluence Bias Map solves this by aggregating trend, momentum, volatility, and volume indicators into a single, real-time score (0 to 100) display
FREE
Impulse Momentum Shift
Nguyen Thanh Trieu
5 (1)
Una candela chiude con un corpo grande. Sembra un breakout. Entrate. La barra successiva si inverte e colpisce il vostro stop. Il volume era nella media. Il momentum stava già sfumando. Impulse Momentum Shift identifica le candele con un vero impulso e segna il momento in cui quell'impulso si inverte. La maggior parte dei trader guarda solo la dimensione della candela. Il vero impulso combina tre fattori: dominanza del corpo, picco di volume sopra la media recente e momentum direzionale normaliz
FREE
Prop Firm Risk Guard
Nguyen Thanh Trieu
5 (1)
Un picco di volatilità durante NFP. Limite di perdita giornaliera raggiunto in pochi secondi. Conto limitato. Questo accade quando l'equity scende più velocemente della reazione manuale durante eventi ad alta volatilità. PropFirm Risk Guard monitora l'equity in tempo reale e reagisce automaticamente quando i limiti definiti vengono avvicinati. Progettato per sfide di prop firm con regole di rischio rigorose: FTMO, The5ers, Funded Trading Plus, MFF. Supporta il calcolo del drawdown sia basato su
Murrey Math Channels Identifying key market reversal points and core trading ranges can be challenging. Traditional analysis often lacks clear mathematical structure, leading to inconsistent entries. Murrey Math Channels provides a mathematically grounded price framework based on the Law of Octaves to help traders define precise support, resistance, and reversal zones. How to Read the Chart: The indicator divides the price action into 8 main octaves (levels), each representing a different marke
FREE
Volume Pressure Meter MT5 La candela sembrava forte. Il volume sembrava alto. Sei entrato sul breakout. Il prezzo si è invertito in pochi minuti. Il movimento non aveva partecipazione reale. Volume Pressure Meter rivela ciò che vedono le istituzioni: se esiste pressione di acquisto o vendita effettiva dietro il movimento del prezzo, o se stai facendo trading contro volume vuoto. Progettato per trader intraday e swing che analizzano Oro (XAUUSD), indici e coppie Forex principali su timeframe da M
Pullback Execution Map
Nguyen Thanh Trieu
4.5 (2)
Price breaks out. You want the continuation, but the entry usually comes too early, too late, or directly into a weak pullback. Without structure, most traders can see the move but still cannot define where the retracement remains healthy and where the setup starts to fail. Pullback Execution Map turns the current swing into a visual execution plan on the chart and a pullback meter below price. What it shows: Fibonacci execution pocket: Maps the active swing with a clear pullback pocket from the
FREE
Smart Entry Levels - Fractal and ATR Based Indicator Smart Entry Levels identifies key support and resistance zones using classical fractal detection and ATR-based volatility measurement. The indicator is designed for clarity, stability, and compliance with MQL5 Market rules. Features Upper Zone - Resistance area based on recent fractal highs Lower Zone - Support area based on recent fractal lows ATR-based sizing - Zones adapt dynamically to market volatility with selectable timeframe Non-repain
FREE
Smart Confluence Radar Leggere tre indicatori separati per trovare la confluenza richiede tempo. Quando il segnale diventa chiaro, il movimento è già partito. Smart Confluence Radar combina espansione ATR, momentum del volume e rate-of-change in un unico livello visivo direttamente sulle candele. Versione gratuita con funzioni principali. Per overlay multi-timeframe, alert e filtro sessioni, vedi Smart Confluence Radar Advanced . Cosa mostra: Candele colorate: Colore brillante indica alte barre
FREE
Parabolic Trend Corridor Identifying trend direction and volatility boundaries is a common challenge for day traders. Standard indicators often lack a holistic view of both trend structure and market noise. Parabolic Trend Corridor solves this by combining the adaptive nature of Parabolic SAR with dynamic ATR volatility bands. Key Features: Adaptive Trend Core: Uses Parabolic SAR as the foundation to follow price movement and volatility changes without lag. Dual-Color Cloud: Dynamic visual feedb
FREE
Session and Cycle Zone Mapper Session and Cycle Zone Mapper displays the Asian, London, and New York trading sessions directly on your MetaTrader 5 chart. Each session is drawn as a colored box showing the high, low, and pip range. The indicator also plots the Asian range as extended key levels, marks previous day high and low, and includes a 24-hour volatility heatmap. Session countdown timers and a dashboard panel keep you oriented within the trading day without switching timeframes or openin
FREE
Apri il terminale. Tre operazioni in corso. Il grafico si muove. Ma Londra e attiva adesso, o e solo rumore prima di New York? Session Pulse Monitor mostra lo stato delle sessioni in tempo reale, il contesto di volatilita e la sessione di ingresso di ogni posizione — direttamente sul tuo grafico. Progettato per trader che gestiscono posizioni su piu sessioni e devono sapere quando il mercato ha partecipazione istituzionale. Funziona su tutti i simboli — ottimizzato per Oro (XAUUSD), principali c
FREE
Keltner Breakout Caught in market chop. Fake breakouts trigger unwanted trades. Because standard indicators lack dynamic volatility context. This utility automatically combines a Dynamic Volatility Channel, Dual MA trend detection, and RSI momentum filtering into one visual system. Key Features: Trend Cloud: Visually fills the trend zone with a dynamic Keltner-style volatility channel. Multi-Factor Breakout: Only issues a signal when price breaks the volatility channel AND trend/momentum confirm
FREE
Gold Structure Pro
Nguyen Thanh Trieu
You read the breakout correctly. Price pushed through the level. You entered. Then it reversed — and stopped you out before the real move happened. GoldStructure Pro identifies that pattern before you enter, not after. Gold fakes breakouts constantly. A candle closes above resistance, volume looks right, structure seems clear — then price snaps back and hunts your stop. Most indicators cannot separate a confirmed expansion from a liquidity sweep. GoldStructure Pro classifies every breakout in re
Buon setup. Stato di mercato sbagliato. L'operazione viene invalidata prima di svilupparsi. Spread ampi, orari fuori sessione, picchi di volatilita e prossimita a notizie ad alto impatto distruggono il vantaggio prima dell'esecuzione. Market Bias Monitor classifica l'ambiente in tempo reale, valuta la qualita di esecuzione da 0 a 100 e vi avvisa nel momento in cui le condizioni cambiano. Progettato per trader discrezionali e semi-automatizzati che analizzano Oro (XAUUSD), coppie Forex e indici s
SMC Liquidity Channel Guard Premium Rottura sopra la resistenza. Stop loss posizionato appena sotto. Il prezzo si inverte immediatamente — uno sweep di liquidita che intrappola le entrate retail prima che inizi il vero movimento. SMC Liquidity Channel Guard Premium mappa i pool di liquidita istituzionale in tempo reale, filtra gli sweep attraverso la logica di tendenza direzionale e fornisce setup confermati con contesto multi-timeframe. Progettato per trader Smart Money Concept che analizzano O
Apri un'operazione in quello che sembra un mercato attivo. Ma la sessione chiude tra 12 minuti. La liquidità cala. Lo spread si allarga. La tua posizione va alla deriva senza direzione. Session Pulse Monitor Advanced fornisce intelligence sulle sessioni in tempo reale — stato live, statistiche storiche, zone visive sul grafico, previsione ATR e avvisi di transizione — così sai sempre in quale sessione stai operando. Progettato per trader che gestiscono posizioni nelle sessioni Asia, Londra e New
La struttura era confermata. L'order block combaciava. Sei entrato sul breakout. Il prezzo si e invertito di 40 pip perche non hai visto la zona premium, non c'era supporto FVG e stavi operando fuori orario Kill Zone. Tre fattori dicevano "no". Ne hai controllato solo uno. SMC Confluence Score MT5 scansiona 8 livelli di analisi istituzionale simultaneamente e genera un punteggio di confluenza bull/bear (0-10) in tempo reale. Invece di passare tra indicatori e timeframe, vedi tutti i fattori SMC
Many pullbacks look tradable for a moment, but the expensive mistake comes from treating every retracement as equal. The real workflow problem is deciding whether the pullback is still worth your attention, whether it is only building, or whether it should be ignored completely. Pullback Execution Map Confluence is built as a decision-first pullback engine: it separates WAIT, BUILD, READY and AVOID conditions before it draws a full execution plan. What this version adds: Decision states instead
Liquidity Trap Confirmation Durante le sessioni intraday più attive, il prezzo può spazzare un chiaro livello di liquidità e invertire prima che il setup sia davvero pronto. Liquidity Trap Confirmation è uno strumento di conferma su barra chiusa per trader discrezionali che preferiscono ridurre gli ingressi deboli invece di ricevere più segnali. Valuta liquidità, struttura, displacement, volatilità e contesto di mercato per mostrare se un setup va osservato, preparato, confermato, invalidato o i
Ultimate Trader Suite is a professional all-in-one indicator for MetaTrader 5, combining five independent analytical modules into a single clean chart interface. Designed for traders who follow institutional price action methodology, it eliminates the need to stack multiple separate indicators. Key features Trend Engine Dual EMA system (fast/slow) combined with an ATR-based Supertrend band. Color-coded direction lines and automatic crossover arrows mark confirmed trend shifts on closed bars only
Confluence Bias Map Multi TF Reading six timeframes at once from separate charts takes time — and by the time you align them all, the setup is already gone. Signals conflict because each timeframe tells a different story with no way to combine them into a single, objective view. Confluence Bias Map Multi TF scans up to six fully customizable timeframes simultaneously, aggregates trend, momentum, volatility, and volume data into a single weighted score (0 to 100), and displays it on one interacti
Sai già come si sente a tradare senza contesto Hai fatto tutto bene. Hai studiato i grafici. Hai imparato il price action. Hai trovato una strategia che funziona — sulla carta. Ma quando ti siedi a tradare dal vivo, qualcosa continua ad andare storto. Entri in un breakout che si trasforma in un fakeout. Tieni una posizione in un trend che era già finito. Resti in un range per ore, sanguinando piccole loss, aspettando un movimento che non arriva mai — o arriva cinque minuti dopo che hai chiuso.
Filtro:
Nessuna recensione
Rispondi alla recensione