Trade history
- Indicatori
-
Andriy Konovalov
 I develop expert advisors, indicators, scripts and libraries in MQL4/MQL5 languages, including using OOP, WinAPI, DLL and complicated mathematical techniques, for real trading with the MetaTrader 4/5 platforms.
 - Versione: 1.3
- Aggiornato: 5 giugno 2021
- Attivazioni: 5
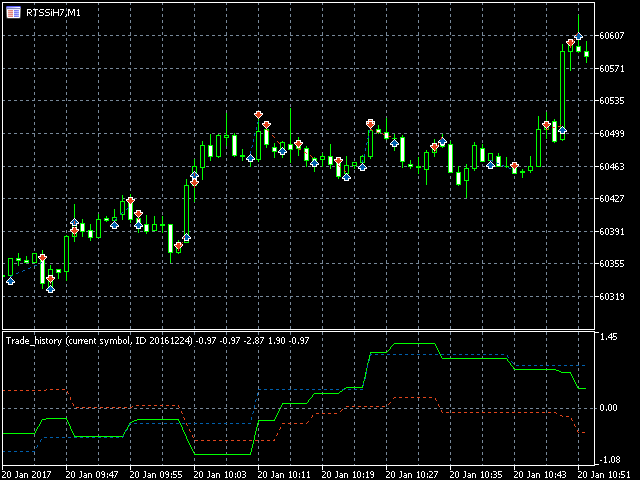
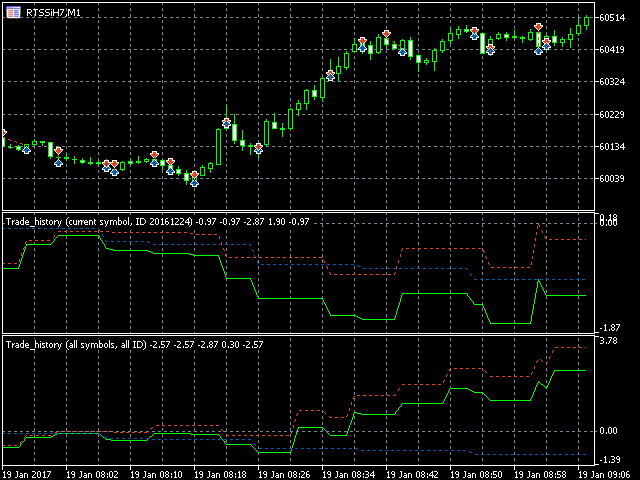
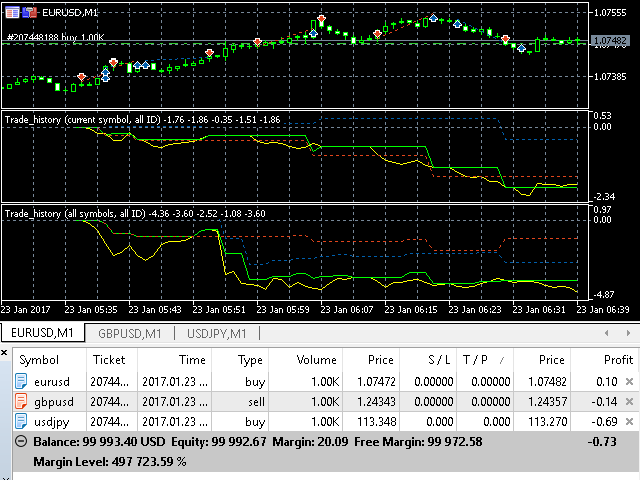
The indicator plots charts of profit taken at the Close of candles for closed (or partially closed) long and short positions individually. The indicator allows to filter deals by the current symbol, specified expert ID (magic number) and the presence (absence) of a substring in a deal comment, to set the start time and the periodicity of profit reset (daily, weekly or monthly) to calculate the profit chart. The indicator also displays the floating (not fixed) profit of the opened positions at the candle closure (only from the moment of initializing indicator).
The indicator works with any timeframes and instruments (including stock exchange). It can be useful for analysis of efficiency of multiple experts trading on different symbols and directions on one account from a certain point of time.
The available history of deals fixing a profit is used to plot charts of the fixed profit.
Additional features of new versions of the indicator are described in the What's New tab.
Unfortunately, although the free demo version of the indicator formally works in the tester of the MetaTrader 5 terminal, but due to the absence of deals in the tester's history, it cannot be used to fully test the indicator's operation.
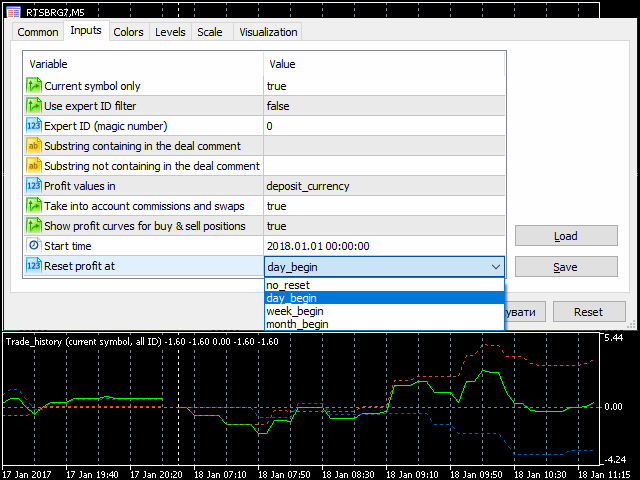
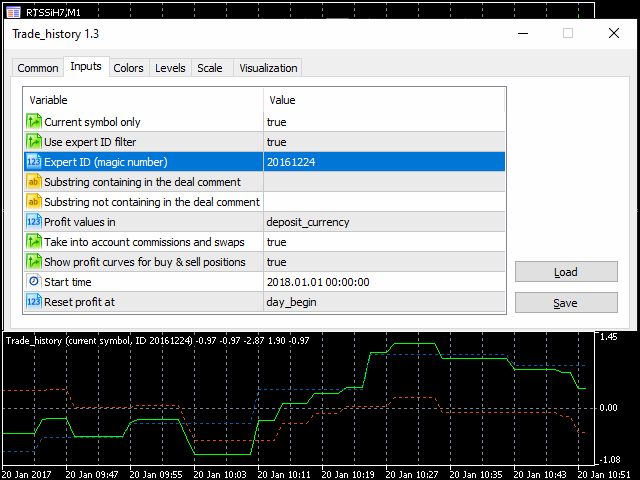
Indicator Parameters
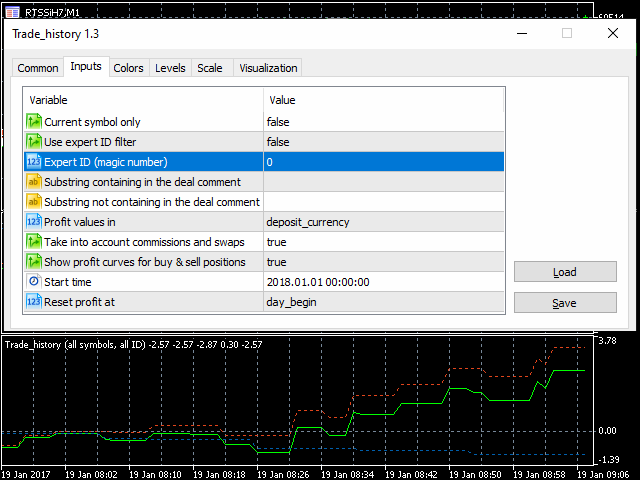
- Current symbol only - boolean parameter (true/false), indicating the need for filtering deals by the current symbol.
- Use expert ID filter - boolean parameter (true/false), indicating the need for filtering deals by expert advisor ID (magic number).
- Expert ID (magic number) - expert advisor ID (integer) which is used in filtering deals by expert ID (for manual trading expert ID equals 0). This parameter is not used when the Use expert ID filter option is set to false.
- Substring containing in the deal comment - string parameter, specifiing a substring that must be contained in deal comments (case sensitive and including all spaces). An empty string disables filtering of deals by containing a substring in the comments.
- Substring not containing in the deal comment - string parameter, specifiing a substring that must not be contained in deal comments (case sensitive and including all spaces). An empty string disables filtering of deals by the absence of a substring in the comments.
- Profit values in - parameter of enumeration type with the values deposit_currency, percentage_of_start_balance to select profit units.
- Take into account commissions and swaps - boolean parameter (true/false), indicating the need for accounting of commission and swap of deals.
- Show profit curves for buy & sell positions - boolean parameter (true/false), indicating the need to display separate charts of fixed profit for long and short positions.
- Start time - date & time parameter, specifying the initial time moment for calculating charts of fixed profit.
- Reset profit at - parameter of enumeration type with the values no_reset, day_begin, week_begin, month_begin. It indicates the need for daily, weekly or monthly reset of profits.
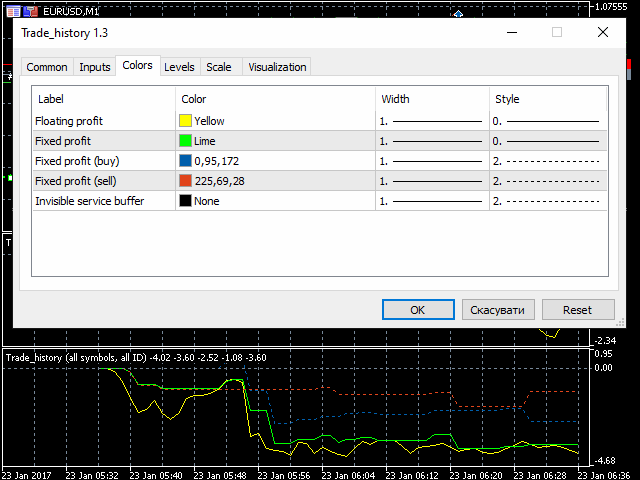
The indicator plots (lines)
- Floating profit - line (solid yellow by default) showing floating (not fixed) profit of positions opened according to the filter settings at the candle closure since the indicator was launched.
- Fixed profit - line (solid lime by default) showing fixed profit at the candle closure for closed (or partially closed) long and short positions according to the filter settings.
- Fixed profit (buy) and Fixed profit (sell) - lines (dotted blue and red by default) showing fixed profit at the candle closure for closed (or partially closed) long and short positions according to the filter settings. These lines are not visible when the Show profit curves for buy & sell positions option is set to false.
- Invisible service buffer - hidden auxiliary buffer which should be ignored.


Отличный индикатор, то что искал. Сам пишу индикаторы и скрипты, но купил готовый. Добавил бы медиану и графики доходности по всем инструментам в одном окне, что бы смотреть корреляцию. Готов подработать вместе.