Murrey Math Channels

Murrey Math Channels

Identifying key market reversal points and core trading ranges can be challenging.
Traditional analysis often lacks clear mathematical structure, leading to inconsistent entries.
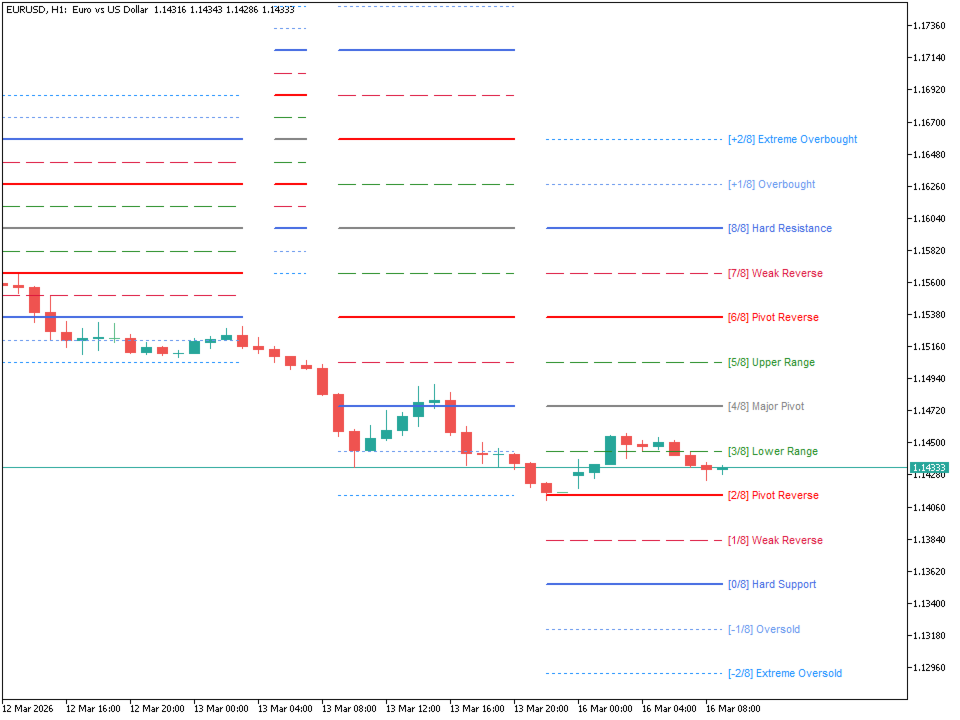
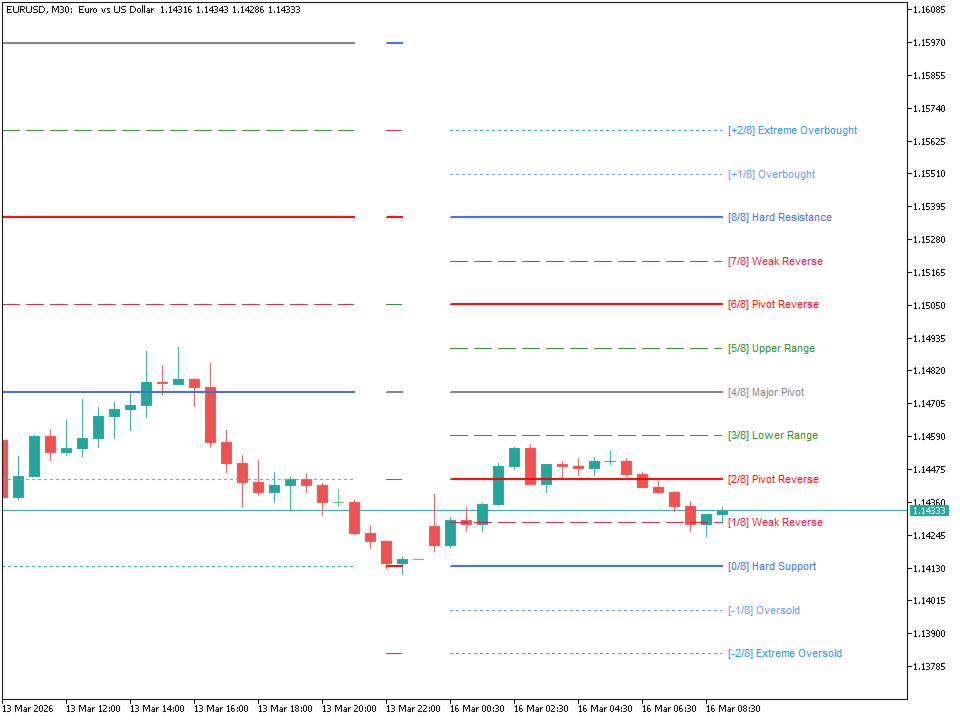
Murrey Math Channels provides a mathematically grounded price framework based on the Law of Octaves to help traders define precise support, resistance, and reversal zones.

How to Read the Chart:

The indicator divides the price action into 8 main octaves (levels), each representing a different market psychological state:

  • [8/8] Hard Resistance: The ultimate ceiling. Price often struggles to break this level on the first attempt.
  • [7/8] Weak Reverse: A warning zone where initial exhaustion often begins.
  • [6/8] & [2/8] Pivot Reverse: Strong reversal points where price frequently changes direction.
  • [5/8] & [3/8] Upper/Lower Trading Range: Zones where price spends 40% of its time consolidating.
  • [4/8] Major Pivot: The most significant level. Price acts as a magnet to this "fair value" center.
  • [1/8] Weak Reverse: A support-side warning zone.
  • [0/8] Hard Support: The ultimate floor. A critical zone for identifying major bottoming structures.
  • [+1/8, +2/8] & [-1/8, -2/8]: Extreme overshoot zones used to identify deep overbought/oversold conditions for sharp "rubber band" reversals.

Key Features:

  • Mathematical Alignment: Precisely calculated levels based on Murrey's Law of Octaves for objective analysis.
  • Categorized Level Strengths: Clean visual coding for different levels (Hard Resistance/Support, Pivot Reverse, Trading Ranges).
  • Real-time Market Psychology: Adaptive text labels describing the primary characteristic of each level (e.g., Major Pivot, Extreme Overbought).
  • Overshoot Monitoring: Automatically calculates extreme exhaustion levels (+-1/8, +-2/8) to monitor potential sharp reversal zones.
  • Multi-Asset Compatibility: Designed to work effectively on Forex, Gold (XAUUSD), Indices, and Stocks.

What it does NOT do:

It does not generate automated buy/sell signals. It does not promise profits or guarantee specific market outcomes. It does not replace the need for professional risk management.

Attach to one chart only.

This utility helps professional traders enforce clear price action limits and identify high-probability reversal structures.

Prodotti consigliati
The standard Bollinger Bands indicator has been improved by integrating additional indications from the Standard Deviation indicator (StdDev), which gives an additional filter for confirming trading signals. In addition, the color of the indicator's lines shows the beginning of a trend, its development and exhaustion. This indicator has a signal block that notifies the trader of the beginning of the trend on any time frame to which it is attached. Settings Type of messages - select the type of
FREE
Round Level MT5
Szymon Palczynski
5 (1)
The fact that round number levels have a significant influence on the market cannot be denied and should not be overlooked. These psychological levels are used by both retail Forex traders and major banks that deal in Forex.  Very simple and effective indicator and most importantly free. ////////////////////////////////////////////////////////////////////////////////////////////////////////////////////////////////////////////////////////////// The program does not work in the strategy tester.
FREE
Asian Range BreakOut
Wachinou Lionnel Pyrrhus Sovi Guidi
Completamente personalizzabile – Adatta l’indicatore al tuo stile di trading modificando parametri come il tempo del range, i colori, gli stili delle linee e le impostazioni di rischio-rendimento. Visualizzazione dei livelli di trading – Disegna automaticamente i livelli di prezzo di entrata, stop loss (SL) e take profit (TP) in base alle condizioni di breakout. Integrazione perfetta con gli Expert Advisor (EAs) – Prendi il pieno controllo delle tue strategie automatizzate aggiungendo ulte
FREE
Fibonacci Moving Averages
Brendan Jonathan Stoyanowski-campbell
2 (1)
OVERVIEW The Fibonacci Moving Averages are a toolkit which allows the user to configure different types of Moving Averages based on key Fibonacci numbers. Moving Averages are used to visualise short-term and long-term support and resistance which can be used as a signal where price might continue or retrace. Moving Averages serve as a simple yet powerful tool that can help traders in their decision-making and help foster a sense of where the price might be moving next. The aim of this scrip
FREE
Bollinger Bands Technical Indicator (BB) is similar to envelopes. The only difference is that the bands of Envelopes are plotted a fixed distance (%) away from the moving average, while the Bollinger Bands are plotted a certain number of standard deviations away from it. Standard deviation is a measure of volatility, therefore Bollinger Bands adjust themselves to the market conditions. When the markets become more volatile, the bands widen and they contract during less volatile periods. This ada
FREE
The Swing High Low and Fibonacci Retracement Indicator is a powerful technical analysis tool designed to identify key price levels and potential reversal zones in the market. It automatically detects recent swing highs and swing lows on the chart and overlays Fibonacci retracement levels based on these points. This indicator helps traders: Visualize market structure by highlighting recent swing points. Identify support and resistance zones using Fibonacci ratios (e.g., 38.2%, 50%, 61.8%). Adapt
FREE
Boom and crash smasher
Lesedi Oliver Seilane
4.51 (47)
Boom and crash smasher free indicator that works on all timeframe from the one minute to the monthly timeframe. the indicator is 100% non-repaint. the indicator come with sound alerts and email push notification the indicator appears on the current candle stick for faster entries can be used on all charts and renko charts orange dot is your sell signal blue dot is your buy signal
FREE
Bande di Bollinger Auto-Ottimizzate – Strumento adattivo di volatilità basato sul comportamento reale del mercato Questo indicatore avanzato per MT4 trova automaticamente i migliori periodi e deviazioni standard simulando operazioni sui dati storici. Invece di parametri fissi, si adatta dinamicamente ai cambiamenti del mercato e alla struttura dei prezzi per creare bande che riflettono più accuratamente la volatilità in tempo reale. Nessuna regolazione manuale necessaria. Funzionalità principali
MYTabogFX Supply & Demand is a powerful price action indicator designed to automatically identify high-probability supply and demand zones in the market. This tool helps traders visualize institutional zones where price is likely to react, reverse, or continue. Built for precision and simplicity, it highlights clean zones based on market structure and price behavior. Key Features: • Automatic Supply and Demand Zone Detection   • Clean and Easy-to-Read Zones   • Multi-Timeframe Support   • Zone
FREE
Multi-timeframe trend indicator based on the ADX / ADXWilder indicator with Fibonacci levels The indicator shows trend areas using ADX or ADXWilder indicator data from multiple timeframes. The impulse mode of the indicator allows you to catch the beginning of a trend, and several "Screens" with different timeframes allow you to filter out market noise. Fibonacci levels are added to the price chart, which have flexible settings. How the indicator works: if PDI is greater than NDI, then   it`s
FREE
Entry IQ MT5
Michael Prescott Burney
3.67 (3)
L'Indicatore Entry IQ è un sofisticato strumento di analisi tecnica progettato per assistere i trader nell'identificazione di punti di ingresso ad alta probabilità per posizioni long e short. Questa utility di trading avanzata sfrutta una combinazione di box di prezzo dinamici, zone di equilibrio e algoritmi proprietari di rilevamento del trend per fornire un'analisi completa delle tendenze di mercato e dell'azione dei prezzi. Sintetizzando questi elementi, l'indicatore offre un quadro robusto
FREE
Sviluppo della versione precedente dell'indicatore ZigZag WaveSize MT4 ZigZag WaveSize - indicatore ZigZag standard modificato con l'aggiunta di informazioni sulla lunghezza d'onda in punti, livelli e diverse logiche di allarme Miglioramenti generali: Adattamento del codice per MetaTrader 5 Lavoro ottimizzato con gli oggetti grafici Novità: Livelli orizzontali agli estremi Scelta del tipo di livelli: orizzontale/raggi/segmenti Filtro per livelli liquidi (non penetrati dal prezzo) Buffer per le
FREE
The indicator highlights the points that a professional trader sees in ordinary indicators. VisualVol visually displays different volatility indicators on a single scale and a common align. Highlights the excess of volume indicators in color. At the same time, Tick and Real Volume, Actual range, ATR, candle size and return (open-close difference) can be displayed. Thanks to VisualVol, you will see the market periods and the right time for different trading operations. This version is intended f
FREE
TV MACD Pro + SNR Support/Resistance is a professional trading tool that combines TradingView-style MACD with adaptive Support & Resistance detection. This indicator includes two core modules that can be turned on or off independently. MACD Module: Features authentic TradingView MACD color scheme, teal/red histogram with volume and shrinkage differentiation. Adjustable parameters include Fast EMA (default 12), Slow EMA (default 26), Signal SMA (default 9), and histogram scale. SNR Module: Au
FREE
Free automatic Fibonacci is an indicator that automatically plots a Fibonacci retracement based on the number of bars you select on the BarsToScan setting in the indicator. The Fibonacci is automatically updated in real time as new highest and lowest values appears amongst the selected bars. You can select which level values to be displayed in the indicator settings. You can also select the color of the levels thus enabling the trader to be able to attach the indicator several times with differe
FREE
Advanced Dynamic RSI The **Advanced Dynamic RSI** indicator builds on the classic Relative Strength Index (RSI) developed by J. Welles Wilder. It incorporates volatility-adaptive overbought and oversold levels using moving averages and standard deviation calculations. This adaptation helps the levels adjust to current market conditions, offering a more responsive oscillator compared to fixed thresholds. The indicator is suitable for various instruments and timeframes, supporting analysis in diff
FREE
Bollinger Bands B
Flavio Javier Jarabeck
4.25 (4)
John Bollinger created this indicator in 2010 as a way to read the original indicator (Bollinger Bands) in a more "technical" way, shown as an oscillator. The typical range of the Bollinger Bands %B is 0 - 0.5 - 1.0, where "0" represents the lower band, the "0.5" the middle band, and "1" the upper band. The line on the indicator represents the Closing prices. As simple as that. SETTINGS Bollinger Bands period of analysis Standard Deviation multiplier Shift Price type to be analyzed If you like
FREE
Auto Fib Retracements
Ross Adam Langlands Nelson
4.2 (5)
Automatic Fibonacci Retracement Line Indicator. This indicator takes the current trend and if possible draws Fibonacci retracement lines from the swing until the current price. The Fibonacci levels used are: 0%, 23.6%, 38.2%, 50%, 61.8%, 76.4%, 100%. This indicator works for all charts over all timeframes. The Fibonacci levels are also recorded in buffers for use by other trading bots. Any comments, concerns or additional feature requirements are welcome and will be addressed promptly. 
FREE
APCT Chart Pattern
Mthandeni Mnyandu
3 (2)
APICT Chart Patterns – Trend Line & Pattern Recognition for MT5 Enhance your technical analysis with the APICT Chart Patterns Indicator — an advanced tool for automatic pattern and trend line detection in MetaTrader 5. Key Features Automatic Pattern Detection: Identifies over 10 classic chart patterns, including pennants, wedges, channels, and double tops/bottoms. Real-Time Trend Lines: Draws support and resistance lines using smart algorithms. Custom Sensitivity: Adjust detection for major or
FREE
This is the Stargogs Volatility Arrow V1 Yeahhh!!! This Arrow is based on trend, support and demand and based on EMA's. You can change the parameters or settings like you want to.  Message Me for the System which works best with this Indicator for free (include: Template, and other indicators). This indicator works with all Currency Pairs, All Volatility indices, All Indices, Boom & Crash Indices, Gold and NASDAQ. Works on All Timeframes Add the following to your chart with Stargogs Volatility A
FREE
The Adaptive Trend Indicator is a dynamic trend-following tool that adjusts its sensitivity based on market volatility, offering a more responsive alternative to classic moving averages. It supports both SMA and EMA modes and changes color based on trend direction or crossovers, giving a clear visual cue for potential entries or exits. Read about recommended usage for different markets, timeframes and trading styles:  Adaptive Trend Indicator Features ATR-based period adaptation for responsive
FREE
Basic Harmonic Pattern MT5
Mehran Sepah Mansoor
4.76 (91)
Questo indicatore identifica i   pattern armonici   più popolari che predicono i punti di inversione del mercato. Questi modelli armonici sono formazioni di prezzo che si ripetono costantemente nel mercato forex e suggeriscono possibili movimenti di prezzo futuri /   Versione MT4 gratuita Inoltre, questo indicatore è dotato di un segnale di entrata nel mercato e di vari take profit e stop loss. Va notato che, sebbene l'indicatore di pattern armonico possa fornire segnali di acquisto/vendita da
FREE
RSI abcd
Francisco Gomes Da Silva
4.33 (3)
RSI ABCD Pattern Finder: Strategia Tecnica 1. Come Funziona l'Indicatore Combina il RSI classico con il rilevamento automatico di pattern armonici ABCD . Componenti Principali RSI standard (periodo regolabile) Marcatori di massimi e minimi (frecce) Pattern ABCD (linee verdi/rosse) Filtri ipercomprato (70) e ipervenduto (30) 2. Configurazione su MT5 period = 14 ; // Periodo RSI size = 4 ; // Dimensione massima del pattern OverBought = 70 ; // Livello ipercomprato OverSold = 30 ; // Livello iperve
FREE
MAs crossing
Roman Ogorodnikov
5 (1)
The indicator draws three Moving Averages. Two short ones cross a long one. At the same time, the long MA changes color: If both short MAs are above the long one - first color; If both short MAs are below the long one - second color; If the two short MAs are on opposite sides of the long one - third color. All three MAs are based on closing prices with a smoothing method of "simple." cross MA cross 3 MA cross three Moving Average across Moving cross Moving crossing  MA crossing MA across MA
FREE
CLICK HERE TO JOIN OUR WHATSAPP GROUP. This trading indicator Automatically identifies and plots contract blocks, which are essential zones marked by significant levels of support and resistance. This powerful tool provides traders with a clear and intuitive visualization of critical market points where prices are likely to bounce or reverse. The contract blocks, represented by distinct colored rectangles, highlight support zones (at the bottom) and resistance zones (at the top), enabling trad
FREE
RFOC Mini Chart Simple
Ronaldo Franco De Oliveira Cardoso
The RFOC Mini Chart was created to project a macro view of the market, which the option to select the timeframe of interest other than the main chart, it is possible to include 2 indicators: In the full version it is possible to include 2 indicators: 1 - Moving average channel On the mini chart, the moving average will be created based on the prices of the selected time frame for the RFOC Mini Chart. The moving average period must be selected in the indicator settings pannel. 2 - Boillinger Ban
FREE
STRUCTURAL TREND LINES - MT4/MT5 Indicator Simple indicator that automatically draws trend lines based on market structure. Features: - 3 degrees of structure detection (short, medium, long term) - Configurable swing strength for each degree - Single color per degree for clean visualization - Adjustable number of lines per degree - Customizable colors and line widths How it works: The indicator identifies swing highs and lows based on the strength parameter, then connects these points to crea
FREE
The custom Bollinger Bands Height indicator measures and displays the current state of the Bollinger Bands indicator, showing whether the bands are widening (moving away from each other) or narrowing (starting to converge). Contraction, indicated by the narrowing of the bands, suggests that the current market movement is losing momentum and hints at the potential start of a new strong movement. This can be a signal to look for an opportune moment to enter a position, as a sharp price change may
FREE
If you are (or were) a fan of the RSI indicator will love Tushar Chande's Dynamic Momentum Index indicator, that simply put is a dynamic variable lenght RSI, so it is more powerful. The DMI indicator internally uses a variable number of bars in its calculations, taking into consideration the volatility levels of the current market you are analyzing. This way, the DMI indicator will use more bars as volatility decreases and less bars when volatility increases, giving you a more powerfull analysis
FREE
PZ Penta O MT5
PZ TRADING SLU
3.5 (4)
The Penta-O is a 6-point retracement harmonacci pattern which usually precedes big market movements. Penta-O patterns can expand and repaint quite a bit. To make things easier this indicator implements a twist: it waits for a donchian breakout in the right direction before signaling the trade. The end result is an otherwise repainting indicator with a very reliable trading signal. The donchian breakout period is entered as an input. [ Installation Guide | Update Guide | Troubleshooting | FAQ | A
FREE
Gli utenti di questo prodotto hanno anche acquistato
ARIPoint
Temirlan Kdyrkhan
1 (1)
ARIPoint is a powerful trading companion designed to generate high-probability entry signals with dynamic TP/SL/DP levels based on volatility. Built-in performance tracking shows win/loss stats, PP1/PP2 hits, and success rates all updated live. Key Features: Buy/Sell signals with adaptive volatility bands Real-time TP/SL/DP levels based on ATR Built-in MA Filter with optional ATR/StdDev volatility Performance stats panel (Success, Profit/Loss, PP1/PP2) Alerts via popup, sound, push, or email Cu
SuperScalp Pro
Van Minh Nguyen
4.59 (22)
SuperScalp Pro – Sistema avanzato di indicatore scalping multi-filtro SuperScalp Pro è un indicatore di scalping avanzato che combina il classico Supertrend con molteplici filtri intelligenti di conferma per aiutare a identificare opportunità di trading. Funziona in modo efficiente su diversi timeframe da M1 a H4, con prestazioni ottimizzate su XAUUSD, BTCUSD e principali coppie Forex. L’indicatore fornisce chiari segnali Buy e Sell, insieme a livelli di ingresso, stop loss e take profit calcola
Entry In The Zone and SMC Multi Timeframe is a real-time 2-in-1 market analysis tool that combines market structure analysis and a No Repaint BUY / SELL signal system into a single indicator, built on Smart Money Concepts (SMC) — a widely adopted framework used by professional traders to understand market structure. This indicator helps you see the market more clearly, make decisions based on structure rather than guesswork, and focus on high-probability zones where price is more likely to react
SignalTech MT5 is a trading system for EURUSD, USDCHF, USDJPY, AUDUSD, NZDUSD, EURJPY, AUDJPY, NZDJPY, CADJPY H2 and H3 Timeframe.  It can generate signals with Buy/Sell Arrows and Pop-Up/Sound Alerts. Each signal has clear Entry and Stop Loss levels, which should be automatically flagged on the chart, as well as potential Targets 1, 2, and 3. The Entry and TP levels are fixed after the trade is taken. The exit level is dynamic. If there are signs of a potential short-term trend reversal, the
Divergence Bomber
Ihor Otkydach
4.9 (87)
Ogni acquirente dell’indicatore riceverà inoltre gratuitamente: L’utilità esclusiva “Bomber Utility”, che gestisce automaticamente ogni operazione, imposta i livelli di Stop Loss e Take Profit e chiude le posizioni secondo le regole della strategia I file di configurazione (set file) per adattare l’indicatore a diversi asset I set file per configurare il Bomber Utility in tre modalità: “Rischio Minimo”, “Rischio Bilanciato” e “Strategia di Attesa” Una guida video passo-passo per installare, conf
Gold Entry Sniper
Tahir Mehmood
5 (8)
Gold Entry Sniper – Dashboard ATR Multi-Timeframe per Scalping e Swing Trading sull’Oro Gold Entry Sniper è un indicatore avanzato per MetaTrader 5 che offre segnali di acquisto/vendita precisi per XAUUSD e altri strumenti, basato sulla logica ATR Trailing Stop e l' analisi multi-timeframe . Caratteristiche e Vantaggi Analisi Multi-Timeframe – Visualizza trend su M1, M5, M15 in un'unica dashboard. Trailing Stop Basato su ATR – Stop dinamici che si adattano alla volatilità. Dashboard Professional
Power Candles MT5
Daniel Stein
5 (8)
Power Candles V3 - Indicatore di forza ad ottimizzazione automatica Power Candles V3 trasforma la forza delle valute e degli strumenti in un piano di trading attuabile su ogni grafico a cui è collegato. Invece di limitarsi a colorare le candele, esegue un'auto-ottimizzazione in tempo reale in background e ti fornisce i migliori valori di Stop Loss, Take Profit e soglia di segnale per il simbolo che hai davanti. Basta un clic per adottarlo nel trading live: i raggi di ingresso, Stop Loss e Take P
FX Trend MT5 NG
Daniel Stein
5 (4)
FX Trend NG: La Nuova Generazione di Intelligenza di Trend Multi-Mercato Panoramica FX Trend NG è uno strumento professionale di analisi del trend multi-timeframe e monitoraggio dei mercati. Ti consente di comprendere la struttura completa del mercato in pochi secondi. Invece di passare tra numerosi grafici, puoi identificare immediatamente quali strumenti sono in trend, dove il momentum sta diminuendo e dove esiste un forte allineamento tra i timeframe. Offerta di Lancio – Ottieni FX Trend NG
Se acquisti questo indicatore, riceverai il mio Trade Manager Professionale + EA  GRATUITAMENTE. Innanzitutto è importante sottolineare che questo sistema di trading è un indicatore Non-Repainting, Non-Redrawing e Non-Lagging, il che lo rende ideale sia per il trading manuale che per quello automatico. Corso online, manuale e download di preset. Il "Sistema di Trading Smart Trend MT5" è una soluzione completa pensata sia per i trader principianti che per quelli esperti. Combina oltre 10 indicat
Grabber System MT5
Ihor Otkydach
4.83 (23)
Ti presento un eccellente indicatore tecnico: Grabber, che funziona come una strategia di trading "tutto incluso", pronta all’uso. In un solo codice sono integrati strumenti potenti per l’analisi tecnica del mercato, segnali di trading (frecce), funzioni di allerta e notifiche push. Ogni acquirente di questo indicatore riceve anche gratuitamente: L’utility Grabber: per la gestione automatica degli ordini aperti Video tutorial passo dopo passo: per imparare a installare, configurare e utilizzare
Gann Made Easy è un sistema di trading Forex professionale e facile da usare che si basa sui migliori principi del trading utilizzando la teoria di mr. WD Gann. L'indicatore fornisce segnali ACQUISTA e VENDI accurati, inclusi i livelli di Stop Loss e Take Profit. Puoi fare trading anche in movimento utilizzando le notifiche PUSH. CONTATTAMI DOPO L'ACQUISTO PER RICEVERE GRATUITAMENTE LE ISTRUZIONI DI TRADING E OTTIMI INDICATORI EXTRA! Probabilmente hai già sentito parlare molte volte dei metodi d
Btmm state engine pro
Garry James Goodchild
5 (4)
BTMM State Engine Pro is a MetaTrader 5 indicator for traders who use the Beat The Market Maker approach: Asian session context, kill zone timing, level progression, peak formation detection, and a multi-pair scanner from a single chart. It combines cycle state logic with a built-in scanner dashboard so you do not need the same tool on many charts at once. What it does Draws the Asian session range; session times can follow broker server offset or be set in inputs. Tracks level progression (L
Quantum TrendPulse
Bogdan Ion Puscasu
5 (23)
Ecco   Quantum TrendPulse   , lo strumento di trading definitivo che combina la potenza di   SuperTrend   ,   RSI   e   Stocastico   in un unico indicatore completo per massimizzare il tuo potenziale di trading. Progettato per i trader che cercano precisione ed efficienza, questo indicatore ti aiuta a identificare con sicurezza le tendenze di mercato, i cambiamenti di momentum e i punti di entrata e uscita ottimali. Caratteristiche principali: Integrazione SuperTrend:   segui facilmente l'andame
Trend Screener Pro MT5
STE S.S.COMPANY
4.85 (104)
Indicatore di tendenza, soluzione unica rivoluzionaria per il trading di tendenze e il filtraggio con tutte le importanti funzionalità di tendenza integrate in un unico strumento! È un indicatore multi-timeframe e multi-valuta al 100% non ridipingibile che può essere utilizzato su tutti i simboli/strumenti: forex, materie prime, criptovalute, indici e azioni. Trend Screener è un indicatore di tendenza che segue un indicatore efficiente che fornisce segnali di tendenza a freccia con punti nel gra
Meridian Pro
Ottaviano De Cicco
5 (1)
Meridian Pro 2.00: Professional Multi-Timeframe Trend Matrix for MT5 Meridian Pro 2.00 is a professional adaptive trend matrix for MetaTrader 5. It combines the original Meridian trend engine, a clean chart ribbon, closed-bar signal arrows, an 8-timeframe dashboard, Fuel momentum, weighted consensus, synthetic HTF processing and chart-native higher-timeframe context lines. The goal is simple: read current trend, multi-timeframe structure, strength, momentum and EA-ready state from one discipline
Presentazione       Quantum Breakout PRO   , l'innovativo indicatore MQL5 che sta trasformando il modo in cui scambi le zone di breakout! Sviluppato da un team di trader esperti con un'esperienza di trading di oltre 13 anni,       Quantum Breakout PRO       è progettato per spingere il tuo viaggio di trading a nuovi livelli con la sua strategia innovativa e dinamica della zona di breakout. Quantum Breakout Indicator ti fornirà frecce di segnalazione sulle zone di breakout con 5 zone target di
OmniSync Projection
Antonio-alin Teculescu
5 (1)
Chronos Fractal Engine is an innovative price projection indicator for MetaTrader 5, designed to transform your technical analysis by intelligently identifying and projecting historical price patterns. Built upon an advanced correlation algorithm and the fractal principles of the market, this powerful tool visualizes potential future price movements, giving you a unique edge in your trading decisions. What is Chronos Fractal Engine? At its core, the Chronos Fractal Engine employs a sophisticat
Questo cruscotto mostra gli ultimi   pattern armonici   disponibili per i simboli selezionati, in modo da risparmiare tempo ed essere più efficienti /   versione MT4 . Indicatore gratuito:   Basic Harmonic Pattern Colonne dell'indicatore Symbol :   vengono visualizzati i simboli selezionati Trend:   rialzista o ribassista Pattern:   tipo di pattern (gartley, butterfly, bat, crab, shark, cypher o ABCD) Entry:   prezzo di ingresso SL:   prezzo di stop loss TP1:   1 prezzo di take profit TP2:
Azimuth Pro
Ottaviano De Cicco
5 (7)
Azimuth Pro V2: Synthetic Fractal Structure and Confirmed Entries for MT5 Overview Azimuth Pro is a multi-level swing structure indicator by Merkava Labs . Four nested swing layers, swing-anchored VWAP, ABC pattern detection, three-timeframe structural filtering, and closed-bar confirmed entries — one chart, one workflow from micro-swings to macro-cycles. This is not a blind signal product. It is a structure-first workflow for traders who care about location, context, and timing. V2 Launch Offe
FX Levels MT5
Daniel Stein
5 (13)
FX Levels: Supporti e Resistenze di Precisione Eccezionale per Tutti i Mercati Panoramica Rapida Cercate un modo affidabile per individuare livelli di supporto e resistenza in ogni mercato—coppie di valute, indici, azioni o materie prime? FX Levels fonde il metodo tradizionale “Lighthouse” con un approccio dinamico all’avanguardia, offrendo una precisione quasi universale. Basato sulla nostra esperienza reale con i broker e su aggiornamenti automatici giornalieri più quelli in tempo reale, FX
Innanzitutto, vale la pena sottolineare che questo Strumento di Trading è un Indicatore Non-Ridipingente, Non-Ridisegnante e Non-Laggante, il che lo rende ideale per il trading professionale. Corso online, manuale utente e demo. L'Indicatore Smart Price Action Concepts è uno strumento molto potente sia per i nuovi che per i trader esperti. Racchiude più di 20 utili indicatori in uno solo, combinando idee di trading avanzate come l'Analisi del Trader del Circolo Interno e le Strategie di Tradin
RelicusRoad Pro: Sistema Operativo Quantitativo di Mercato 70% DI SCONTO ACCESSO A VITA (TEMPO LIMITATO) - UNISCITI A 2.000+ TRADER Perché la maggior parte dei trader fallisce anche con indicatori "perfetti"? Perché operano su Singoli Concetti isolati. Un segnale senza contesto è una scommessa. Per vincere serve CONFLUENZA . RelicusRoad Pro non è un semplice indicatore. È un Ecosistema Quantitativo completo . Mappa la "Fair Value Road", distinguendo tra rumore e rotture strutturali. Smetti di in
Atomic Analyst MT5
Issam Kassas
3.94 (31)
Innanzitutto, vale la pena sottolineare che questo indicatore di trading non è repaint, non è ridisegno e non presenta ritardi, il che lo rende ideale sia per il trading manuale che per quello automatico. Manuale utente: impostazioni, input e strategia. L'Analista Atomico è un indicatore di azione del prezzo PA che utilizza la forza e il momentum del prezzo per trovare un miglior vantaggio sul mercato. Dotato di filtri avanzati che aiutano a rimuovere rumori e segnali falsi, e aumentare il pote
Top indicator for MT5   providing accurate signals to enter a trade without repainting! It can be applied to any financial assets:   forex, cryptocurrencies, metals, stocks, indices .  Watch  the video  (6:22) with an example of processing only one signal that paid off the indicator! MT4 version is here It will provide pretty accurate trading signals and tell you when it's best to open a trade and close it. Most traders improve their trading results during the first trading week with the help of
Trend indicator AI mt5
Ramil Minniakhmetov
5 (17)
Trend Ai indicator è un ottimo strumento che migliorerà l'analisi di mercato di un trader combinando l'identificazione della tendenza con punti di ingresso utilizzabili e avvisi di inversione. Questo indicatore consente agli utenti di navigare nelle complessità del mercato forex con fiducia e precisione Oltre ai segnali primari, l'indicatore Ai di tendenza identifica i punti di ingresso secondari che si presentano durante i pullback o i ritracciamenti, consentendo ai trader di capitalizzare le
Market Structure Order Block Dashboard MT5 è un indicatore MT5 progettato per i trader che vogliono leggere la struttura di mercato e le principali zone di reazione del prezzo direttamente sul grafico. Combina BOS, ChoCH, Order Blocks, Fair Value Gaps (FVG), Liquidità, Kill Zones, Volume Profile e un pannello compatto per un'analisi rapida. Questo indicatore è rivolto ai trader che utilizzano la struttura di mercato, i concetti ICT e Smart Money come quadro decisionale. Può aiutare a individuare
Cominciamo con la verità. Nessun indicatore da solo ti renderà profittevole. Se qualcuno ti dice il contrario, ti sta vendendo un sogno. Qualsiasi indicatore che mostra frecce perfette di acquisto/vendita può essere reso impeccabile — basta ingrandire la giusta sezione della storia e catturare solo i trade vincenti. Noi non lo facciamo.  SMC Intraday Formula è uno strumento. Legge la struttura del mercato per te, identifica le zone a più alta probabilità e ti mostra esattamente come appare la t
Smart Stop Indicator – Precisione intelligente dello stop-loss direttamente sul grafico Panoramica Smart Stop Indicator è la soluzione ideale per i trader che desiderano posizionare il loro stop-loss in modo chiaro e metodico, senza dover indovinare o affidarsi all’intuizione. Questo strumento combina la logica classica del price action (massimi e minimi strutturali) con un moderno riconoscimento dei breakout per identificare il prossimo livello di stop realmente logico. In trend, in range o i
Crystal Heikin Ashi Signals
Muhammad Jawad Shabir
5 (2)
Crystal Heikin Ashi Signals - Professional Trend & Signal Detection Indicator Advanced Heikin Ashi Visualization with Intelligent Signal System for Manual & Automated Trading Final Price: $149 ---------> Price goes up $10 after every 10 sales . Limited slots available — act fast . Overview Crystal Heikin Ashi Signals is a professional-grade MetaTrader 5 indicator that combines pure Heikin Ashi candle visualization with an advanced momentum-shift detection system. Designed for both manual traders
ARICoins
Temirlan Kdyrkhan
ARICoin is a powerful trading companion designed to generate high-probability entry signals with dynamic TP/SL/DP levels based on volatility. Built-in performance tracking shows win/loss stats, PP1/PP2 hits, and success rates all updated live. Key Features: Buy/Sell signals with adaptive volatility bands Real-time TP/SL/DP levels based on ATR Built-in MA Filter with optional ATR/StdDev volatility Performance stats panel (Success, Profit/Loss, PP1/PP2) Alerts via popup, sound, push, or email Cust
Altri dall’autore
Trade Command Center
Nguyen Thanh Trieu
5 (2)
Conto finanziato. Un lotto calcolato male. Limite di drawdown superato. Conto chiuso. Non perche la strategia ha fallito. Perche il rischio non e stato applicato al momento dell'esecuzione. Trade Command Center e un pannello visuale di esecuzione trade e gestione del rischio. Calcola il lotto dalla distanza SL. Gestisce le posizioni automaticamente. Monitora i limiti di drawdown in tempo reale. Cinque schede. Un pannello grafico. Nessuna DLL. Nessuna connessione esterna. Progettato per trader ma
Manual position management. Missing SL. Price moves against you. No protection. Trade Manager Lite automates Stop Loss, Take Profit, Trailing Stop, and Break-Even for your open positions. Attach to one chart. Configure your default SL/TP distance. Let it manage your positions automatically. What's Included (FREE Version) Auto SL/TP: Applies missing Stop Loss and Take Profit to positions based on your configured distance in points Trailing Stop: Adjusts SL dynamically as price moves in your favor
FREE
Morvan
Nguyen Thanh Trieu
MORVAN Sono Morvan. Leggo la direzione. Aspetto la struttura. Colpisco solo quando il prezzo raggiunge il livello dove il movimento ha la maggiore probabilita di svilupparsi. Nessuna supposizione. Nessun trade di vendetta. Nessun inseguimento di candele nel rumore. Eseguo solo quando la struttura si allinea — e gestisco ogni posizione dall'ingresso all'uscita con disciplina. La maggior parte dei trader non perde perche non sa leggere un grafico. Perdono perche entrano troppo tardi, dimensionano
SMC Liquidity Channel Guard
Nguyen Thanh Trieu
5 (2)
SMC Liquidity Channel Guard Prices reverse just as your breakout trade triggers. Account suffers unexpected drawdown. Because standard channels ignore institutional liquidity sweeps and trap retail stop-loss orders. This utility automatically monitors highest buy-side and lowest sell-side liquidity pools to flag false breakouts. Key Features: Dynamic Liquidity Tracking: Maps Buy-Side (BSL) and Sell-Side (SSL) boundaries without lagging moving averages. Sweep Identification: Prints precise direct
FREE
Volume Pressure Meter breakdown tick volume to reveal the buying and selling pressure inside every candle. Unlike standard volume which only shows total activity, this indicator splits volume to show who is actually in control of the market. It helps you identify trend strength and spot potential reversals through volume divergence. Key Features: Pressure Gauge: Visual bar showing real-time Buy vs Sell percentages. Trend Bias: Automatically identifies if the market is dominated by Buyers or Sell
FREE
Smart Session Box Displays Asia, London, and New York trading sessions with automatic timezone adjustment and session overlap highlighting. Main Features Complete session analysis with no limitations. Key Features The indicator draws session boxes with high and low lines for each trading session. Session overlaps are highlighted with distinct colors to identify high liquidity periods. Breakout alerts notify when price crosses previous session levels. A control panel provides quick toggles for al
FREE
Impulse Momentum Shift
Nguyen Thanh Trieu
5 (1)
Una candela chiude con un corpo grande. Sembra un breakout. Entrate. La barra successiva si inverte e colpisce il vostro stop. Il volume era nella media. Il momentum stava già sfumando. Impulse Momentum Shift identifica le candele con un vero impulso e segna il momento in cui quell'impulso si inverte. La maggior parte dei trader guarda solo la dimensione della candela. Il vero impulso combina tre fattori: dominanza del corpo, picco di volume sopra la media recente e momentum direzionale normaliz
FREE
Pullback Execution Map
Nguyen Thanh Trieu
4 (1)
Price breaks out. You want the continuation, but the entry usually comes too early, too late, or directly into a weak pullback. Without structure, most traders can see the move but still cannot define where the retracement remains healthy and where the setup starts to fail. Pullback Execution Map turns the current swing into a visual execution plan on the chart and a pullback meter below price. What it shows: Fibonacci execution pocket: Maps the active swing with a clear pullback pocket from the
FREE
Prop Firm Risk Guard
Nguyen Thanh Trieu
5 (1)
Un picco di volatilità durante NFP. Limite di perdita giornaliera raggiunto in pochi secondi. Conto limitato. Questo accade quando l'equity scende più velocemente della reazione manuale durante eventi ad alta volatilità. PropFirm Risk Guard monitora l'equity in tempo reale e reagisce automaticamente quando i limiti definiti vengono avvicinati. Progettato per sfide di prop firm con regole di rischio rigorose: FTMO, The5ers, Funded Trading Plus, MFF. Supporta il calcolo del drawdown sia basato su
Volume Pressure Meter MT5 La candela sembrava forte. Il volume sembrava alto. Sei entrato sul breakout. Il prezzo si è invertito in pochi minuti. Il movimento non aveva partecipazione reale. Volume Pressure Meter rivela ciò che vedono le istituzioni: se esiste pressione di acquisto o vendita effettiva dietro il movimento del prezzo, o se stai facendo trading contro volume vuoto. Progettato per trader intraday e swing che analizzano Oro (XAUUSD), indici e coppie Forex principali su timeframe da M
Smart Entry Levels - Fractal and ATR Based Indicator Smart Entry Levels identifies key support and resistance zones using classical fractal detection and ATR-based volatility measurement. The indicator is designed for clarity, stability, and compliance with MQL5 Market rules. Features Upper Zone - Resistance area based on recent fractal highs Lower Zone - Support area based on recent fractal lows ATR-based sizing - Zones adapt dynamically to market volatility with selectable timeframe Non-repain
FREE
Smart Confluence Radar Leggere tre indicatori separati per trovare la confluenza richiede tempo. Quando il segnale diventa chiaro, il movimento è già partito. Smart Confluence Radar combina espansione ATR, momentum del volume e rate-of-change in un unico livello visivo direttamente sulle candele. Versione gratuita con funzioni principali. Per overlay multi-timeframe, alert e filtro sessioni, vedi Smart Confluence Radar Advanced . Cosa mostra: Candele colorate: Colore brillante indica alte barre
FREE
Keltner Breakout Caught in market chop. Fake breakouts trigger unwanted trades. Because standard indicators lack dynamic volatility context. This utility automatically combines a Dynamic Volatility Channel, Dual MA trend detection, and RSI momentum filtering into one visual system. Key Features: Trend Cloud: Visually fills the trend zone with a dynamic Keltner-style volatility channel. Multi-Factor Breakout: Only issues a signal when price breaks the volatility channel AND trend/momentum confirm
FREE
Gold Structure Pro
Nguyen Thanh Trieu
You read the breakout correctly. Price pushed through the level. You entered. Then it reversed — and stopped you out before the real move happened. GoldStructure Pro identifies that pattern before you enter, not after. Gold fakes breakouts constantly. A candle closes above resistance, volume looks right, structure seems clear — then price snaps back and hunts your stop. Most indicators cannot separate a confirmed expansion from a liquidity sweep. GoldStructure Pro classifies every breakout in re
Apri il terminale. Tre operazioni in corso. Il grafico si muove. Ma Londra e attiva adesso, o e solo rumore prima di New York? Session Pulse Monitor mostra lo stato delle sessioni in tempo reale, il contesto di volatilita e la sessione di ingresso di ogni posizione — direttamente sul tuo grafico. Progettato per trader che gestiscono posizioni su piu sessioni e devono sapere quando il mercato ha partecipazione istituzionale. Funziona su tutti i simboli — ottimizzato per Oro (XAUUSD), principali c
FREE
Buon setup. Stato di mercato sbagliato. L'operazione viene invalidata prima di svilupparsi. Spread ampi, orari fuori sessione, picchi di volatilita e prossimita a notizie ad alto impatto distruggono il vantaggio prima dell'esecuzione. Market Bias Monitor classifica l'ambiente in tempo reale, valuta la qualita di esecuzione da 0 a 100 e vi avvisa nel momento in cui le condizioni cambiano. Progettato per trader discrezionali e semi-automatizzati che analizzano Oro (XAUUSD), coppie Forex e indici s
Parabolic Trend Corridor Identifying trend direction and volatility boundaries is a common challenge for day traders. Standard indicators often lack a holistic view of both trend structure and market noise. Parabolic Trend Corridor solves this by combining the adaptive nature of Parabolic SAR with dynamic ATR volatility bands. Key Features: Adaptive Trend Core: Uses Parabolic SAR as the foundation to follow price movement and volatility changes without lag. Dual-Color Cloud: Dynamic visual feedb
FREE
SMC Liquidity Channel Guard Premium Rottura sopra la resistenza. Stop loss posizionato appena sotto. Il prezzo si inverte immediatamente — uno sweep di liquidita che intrappola le entrate retail prima che inizi il vero movimento. SMC Liquidity Channel Guard Premium mappa i pool di liquidita istituzionale in tempo reale, filtra gli sweep attraverso la logica di tendenza direzionale e fornisce setup confermati con contesto multi-timeframe. Progettato per trader Smart Money Concept che analizzano O
Apri un'operazione in quello che sembra un mercato attivo. Ma la sessione chiude tra 12 minuti. La liquidità cala. Lo spread si allarga. La tua posizione va alla deriva senza direzione. Session Pulse Monitor Advanced fornisce intelligence sulle sessioni in tempo reale — stato live, statistiche storiche, zone visive sul grafico, previsione ATR e avvisi di transizione — così sai sempre in quale sessione stai operando. Progettato per trader che gestiscono posizioni nelle sessioni Asia, Londra e New
La struttura era confermata. L'order block combaciava. Sei entrato sul breakout. Il prezzo si e invertito di 40 pip perche non hai visto la zona premium, non c'era supporto FVG e stavi operando fuori orario Kill Zone. Tre fattori dicevano "no". Ne hai controllato solo uno. SMC Confluence Score MT5 scansiona 8 livelli di analisi istituzionale simultaneamente e genera un punteggio di confluenza bull/bear (0-10) in tempo reale. Invece di passare tra indicatori e timeframe, vedi tutti i fattori SMC
Many pullbacks look tradable for a moment, but the expensive mistake comes from treating every retracement as equal. The real workflow problem is deciding whether the pullback is still worth your attention, whether it is only building, or whether it should be ignored completely. Pullback Execution Map Confluence is built as a decision-first pullback engine: it separates WAIT, BUILD, READY and AVOID conditions before it draws a full execution plan. What this version adds: Decision states instead
Liquidity Trap Confirmation Durante le sessioni intraday più attive, il prezzo può spazzare un chiaro livello di liquidità e invertire prima che il setup sia davvero pronto. Liquidity Trap Confirmation è uno strumento di conferma su barra chiusa per trader discrezionali che preferiscono ridurre gli ingressi deboli invece di ricevere più segnali. Valuta liquidità, struttura, displacement, volatilità e contesto di mercato per mostrare se un setup va osservato, preparato, confermato, invalidato o i
Filtro:
Nessuna recensione
Rispondi alla recensione