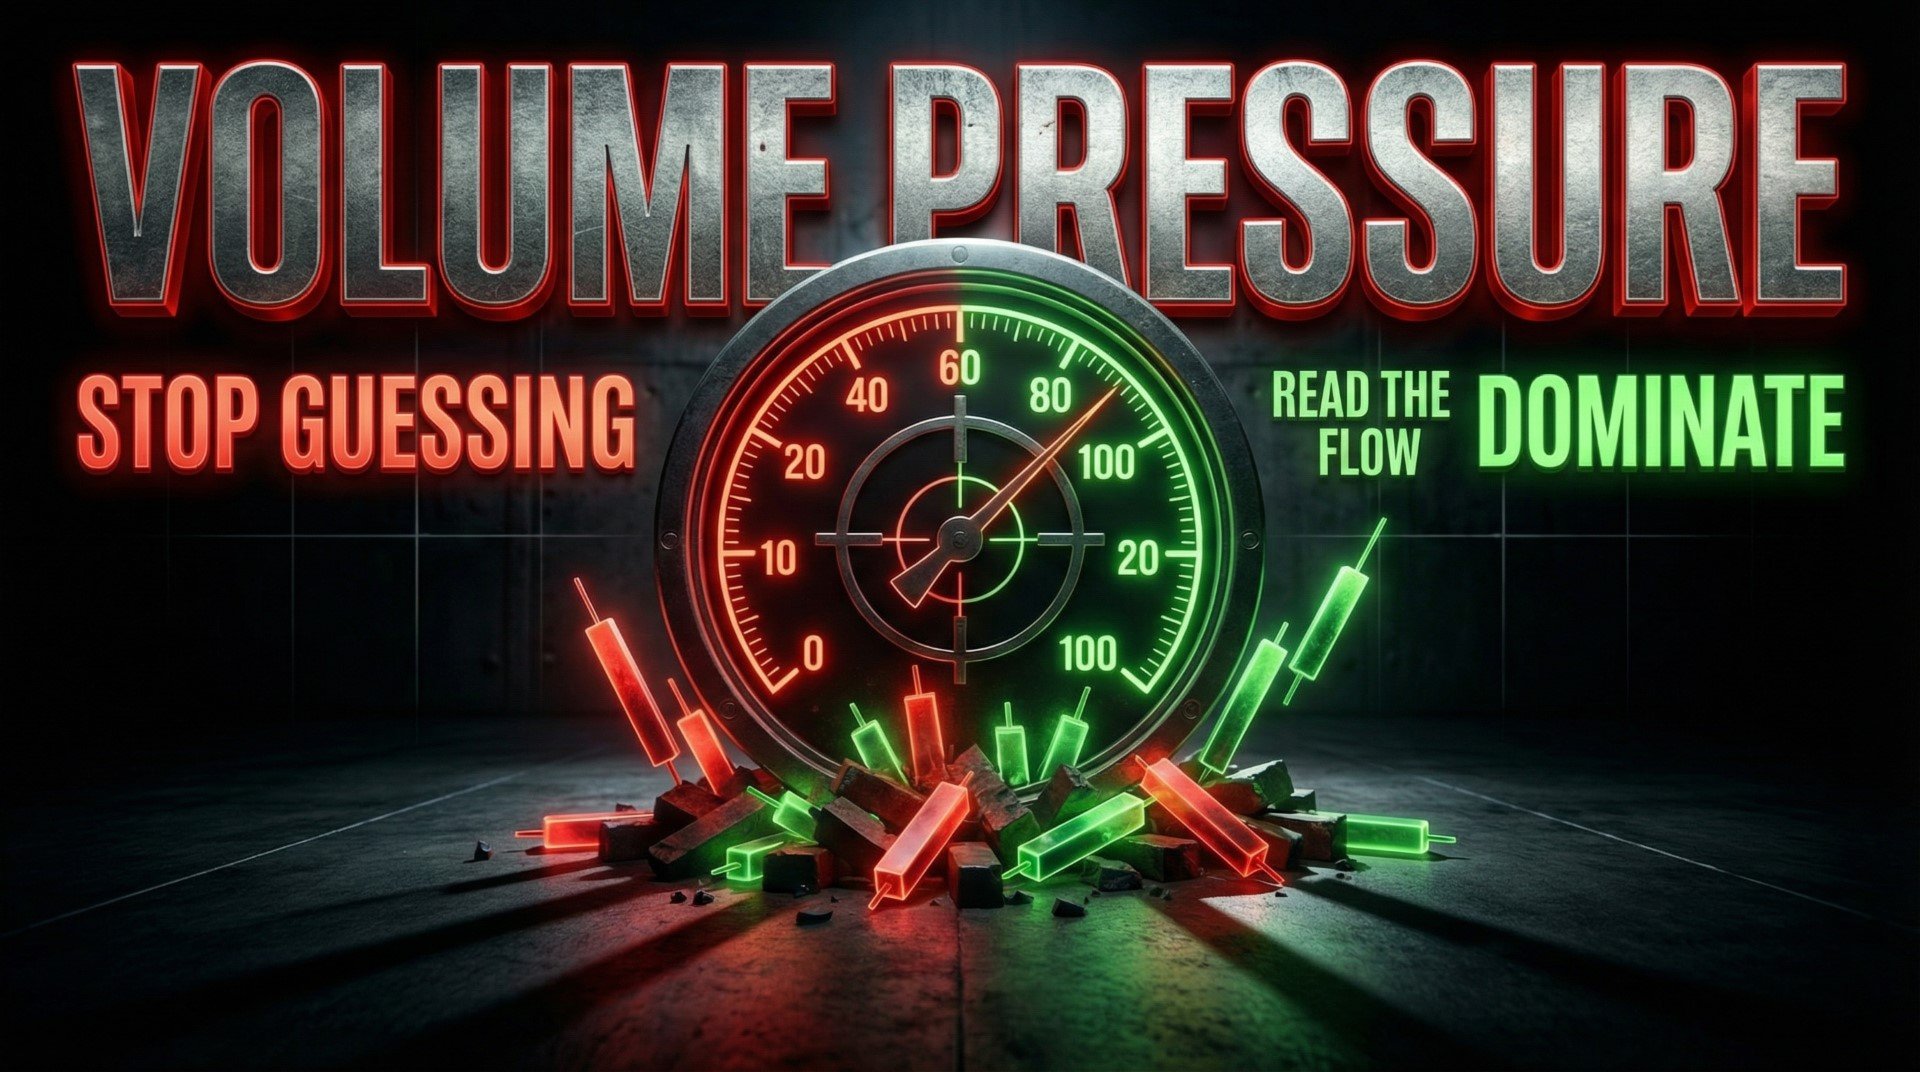
Volume Pressure Meter MT5
- Indicatori
-
Nguyen Thanh Trieu
 I am a software developer and trader focused on building practical trading tools for MetaTrader 5.
My work is centered on:
- Market structure analysis
- Price action logic
- Risk visualization
- Custom indicators and utilities - Versione: 3.0
- Aggiornato: 9 marzo 2026
- Attivazioni: 10
Volume Pressure Meter MT5
La candela sembrava forte. Il volume sembrava alto. Sei entrato sul breakout.
Il prezzo si è invertito in pochi minuti. Il movimento non aveva partecipazione reale.
Volume Pressure Meter rivela ciò che vedono le istituzioni: se esiste pressione di acquisto o vendita effettiva dietro il movimento del prezzo, o se stai facendo trading contro volume vuoto.
Progettato per trader intraday e swing che analizzano Oro (XAUUSD), indici e coppie Forex principali su timeframe da M5 a H4. Combina otto strumenti di analisi del volume di livello istituzionale in un sistema integrato con riconoscimento pattern AI e calcoli di probabilità in tempo reale.
Cosa mostra
Interfaccia HUD (head-up display):
- Stato del segnale: Raccomandazione attuale del mercato (BUY, SELL, WAIT, AVOID) aggiornata in tempo reale
- Indicatore di equilibrio pressione: Rappresentazione visiva della partecipazione acquirenti versus venditori con intensità codificata per colore
- Punteggio del segnale: Valutazione di forza da 0 a 10 basata su molteplici fattori di conferma del volume
- Probabilità di successo: Probabilità di successo in tempo reale calcolata dalle condizioni attuali e dai dati storici di performance
- Classificazione stato del mercato: Zone di Pressione Valida, Pressione Falsa, Accumulazione, Distribuzione o Compressione
- Conferma multi-timeframe: Bias del timeframe superiore mostrato per contesto
Analisi visiva sul grafico:
- Istogramma pressione acquisto/vendita: Separa la pressione di acquisto dalla pressione di vendita su ogni barra nella finestra indicatore separata
- Etichette contestuali fluttuanti: Raccomandazioni di azione posizionate vicino al prezzo corrente (Entry Now, Wait for Pullback, Wait for Breakout, Take Profit, Avoid)
- Marcatori pattern AI: Zone di accumulazione rilevate automaticamente, aree di distribuzione, formazioni spring e upthrust di Wyckoff con punteggio di confidenza
- Alert divergenza smart money: Marcati quando prezzo e pressione del volume si muovono in direzioni opposte (istituzioni che si posizionano prima che i retail se ne accorgano)
Motore di riconoscimento pattern AI
Rileva automaticamente impronte istituzionali che richiederebbero un'analisi manuale estensiva:
- Zone di accumulazione: Aree dove lo smart money costruisce posizioni silenziosamente durante l'azione del prezzo laterale o discendente
- Zone di distribuzione: Regioni dove le istituzioni scaricano posizioni in forza mentre i compratori retail entrano
- Spring di Wyckoff: Falsa rottura sotto il supporto con rapida inversione, indicando assorbimento da parte dei compratori
- Upthrust di Wyckoff: Falso breakout sopra la resistenza seguito da rifiuto, segnalando distribuzione
- Assorbimento di volume: Grande volume con movimento di prezzo minimo, suggerendo forte forza opposta ai livelli chiave
- Volume climatico: Pattern di esaurimento dove i picchi di volume coincidono con punti di terminazione del trend
Ogni pattern viene visualizzato con percentuale di confidenza e contesto descrittivo. Queste formazioni spesso precedono significative inversioni di prezzo o movimenti di continuazione.
Rilevamento divergenza smart money
Identifica momenti in cui l'attività istituzionale contraddice l'azione del prezzo retail:
Divergenza rialzista: Il prezzo fa minimi più bassi mentre la pressione d'acquisto aumenta. Istituzioni che accumulano durante debolezza.
Divergenza ribassista: Il prezzo fa massimi più alti mentre la pressione di vendita aumenta. Istituzioni che distribuiscono in forza.
Le divergenze vengono marcate automaticamente sul grafico quando rilevate. Questi segnali spesso indicano punti di svolta dove lo smart money si posiziona prima dei cambiamenti di trend.
Heatmap del volume e supporto/resistenza basati sul volume
Analisi di distribuzione del prezzo su cinquanta livelli che mostra dove si concentra l'attività di trading reale. Linee di supporto e resistenza tracciate automaticamente basate su cluster di volume, non punti pivot tradizionali.
Questi livelli rappresentano zone dove le istituzioni hanno accumulato o distribuito posizioni significative. Il prezzo tende a reagire quando revisita aree di alta concentrazione storica di volume.
Calcolatore di probabilità di successo
Stima di probabilità in tempo reale per le condizioni attuali del mercato. Integra punteggio del segnale, classificazione dello stato del mercato, regime di volatilità, pattern rilevati, qualità della sessione e allineamento multi-timeframe.
I risultati storici dei segnali vengono tracciati automaticamente. Tasso di vincita, vincitore medio e perdente medio calcolati dai segnali passati. Il sistema apprende continuamente quali condizioni producono setup affidabili nei tuoi strumenti tradati.
Raccomandazioni di setup di trading
| Raccomandazione | Condizione |
|---|---|
| Entry Now | Tutti i fattori di conferma allineati. Condizioni di probabilità ottimali soddisfatte. |
| Wait for Pullback | Segnale valido ma miglior prezzo di entrata in avvicinamento. Livello attuale subottimale. |
| Wait for Breakout | Compressione rilevata. Espansione di volatilità in attesa. Entrata prematura rischia consolidamento. |
| Take Profit | A zona di resistenza o supporto basata sul volume. Considera uscita parziale o completa. |
| Avoid | Setup a bassa probabilità. Segnali conflittuali. Falsa pressione rilevata. Stai fuori. |
Quando le condizioni di entrata si allineano, zone target proiettate e livelli di stop suggeriti vengono visualizzati sul grafico. Questi sono livelli guida basati sull'analisi del profilo di volume, non risultati garantiti.
Sistema di classificazione dello stato del mercato
| Stato | Contesto di trading |
|---|---|
| Valid Pressure | Volume e struttura del prezzo supportano la lettura attuale. Condizioni favorevoli per trading direzionale. |
| False Pressure | Il contesto suggerisce formazione di trappola. Volume presente ma manca conferma strutturale. Alto rischio di inversione. |
| Accumulation | AI ha rilevato costruzione di posizioni smart money. Prezzo laterale con pressione d'acquisto crescente. Anticipa eventuale breakout rialzista. |
| Distribution | AI ha rilevato scaricamento di posizioni smart money. Prezzo laterale o ascendente con pressione di vendita crescente. Anticipa eventuale breakdown ribassista. |
| Compression | Compressione di volatilità rilevata. Range in restringimento. Attendi espansione prima di entrare trade direzionali. |
Filtraggio qualità della sessione
Adatta l'analisi in base alla sessione di trading. Sessione asiatica (basso volume) riceve punteggi di probabilità più bassi. Sessioni di Londra e New York (alto volume) ricevono punteggi più alti. Periodi di sovrapposizione sessioni marcati come finestre di trading premium.
Offset GMT configurabile per diversi orari server del broker. Garantisce accuratezza del rilevamento sessione indipendentemente dalla posizione del broker.
Dashboard di analisi delle performance
Ogni risultato del segnale viene tracciato automaticamente quando il monitoraggio delle performance è abilitato. Tasso di vincita storico visualizzato. Vincitore medio versus perdente medio confrontati. Conteggio totale dei segnali e tasso di successo mostrati.
Questo meccanismo di feedback rivela quali condizioni di mercato producono segnali affidabili per i tuoi strumenti e timeframe specifici. Usa questi dati per perfezionare quali setup scegli di tradare.
Opzioni di visualizzazione
Quattro modalità istogramma: Acquisto e vendita separati (predefinito), Delta (pressione netta), Solo acquisto, Solo vendita.
Modalità compatta: Solo istogramma con etichette fluttuanti. Pannello nascosto per massimo spazio grafico.
Glassmorphism UI: Interfaccia moderna traslucida con transizioni di segnale animate.
Etichette di testo barra: Valori opzionali B:XX S:XX visualizzati sulle barre dell'istogramma per riferimento numerico preciso.
Integrazione multi-timeframe
La conferma dal timeframe superiore viene visualizzata nel HUD. Configurabile da M15 a H4. Quando il segnale del timeframe inferiore si allinea con la direzione di pressione del timeframe superiore, il punteggio di probabilità aumenta automaticamente.
Questo contesto previene trade contro-trend contro il flusso istituzionale dominante visibile su timeframe più grandi.
Miglior uso per
Scalper e day trader su timeframe M5 a M15 che analizzano conferma del volume ai livelli di prezzo chiave.
Swing trader su timeframe H1 a H4 che identificano fasi di accumulazione e distribuzione prima dei breakout.
Trader di breakout che attendono transizioni da compressione a espansione con conferma del volume.
Trader di inversione che cercano segnali di divergenza e trappole di falsa pressione agli estremi.
Ottimizzato per strumenti ad alto volume: Oro (XAUUSD), US30, NAS100, GER40, coppie Forex principali (EURUSD, GBPUSD). Funziona su tutti i simboli ma l'analisi del volume è più affidabile su mercati liquidi.
Cosa NON fa
Non genera segnali automatizzati di acquisto e vendita che ti dicono quale pulsante premere.
Non prevede il movimento futuro del prezzo con certezza.
Non garantisce trade profittevoli o tassi di vincita specifici.
Non sostituisce la tua strategia di trading o le regole di gestione del rischio.
Fornisce analisi del volume di livello istituzionale e contesto di probabilità per supportare il TUO processo decisionale.
Fondamento tecnico
Nessun repainting: Tutti i segnali e pattern si finalizzano alla chiusura della barra. La visualizzazione storica corrisponde al comportamento in tempo reale.
Compatibilità universale: Funziona su tutti i simboli e timeframe. I calcoli si adattano alle caratteristiche dello strumento.
Alert configurabili: Opzioni popup, notifica push e email quando viene superata la soglia di qualità del segnale.
Basso utilizzo CPU: Motore di calcolo efficiente. Nessun degrado delle prestazioni con grafici multipli.
Solo MT5: Utilizza funzionalità avanzate MT5 non disponibili in MT4.
Configurazione
Allega a qualsiasi grafico. Configura soglia minima di qualità del segnale (predefinito 6.0). Abilita funzionalità premium desiderate (pattern AI, divergenza smart money, heatmap volume, tracciamento performance). Regola offset GMT per corrispondere all'orario del server del tuo broker per rilevamento sessione accurato. Pronto all'uso.
Per spiegazioni dettagliate dei parametri di input e opzioni di configurazione avanzate, consulta la sezione Commenti del prodotto e le risorse di supporto.
Il trading comporta un rischio sostanziale di perdita e non è adatto a tutti gli investitori. Questo indicatore fornisce strumenti analitici per l'analisi della pressione del volume. Le performance passate dei segnali non garantiscono risultati futuri. Testa accuratamente in ambiente demo prima dell'uso live. Nessun indicatore elimina il rischio di trading.
Volume Pressure Meter MT5
Per supporto e domande, usa la sezione Commenti qui sotto o visita il profilo dello sviluppatore.