Stochastic Multi Timeframe Dashboard
- Experts
-
Kemran Feitulov
 Hello. You might know me as the author of the popular tool https://www.mql5.com/en/code/65373 in the CodeBase.
 - Versione: 1.3
- Attivazioni: 10
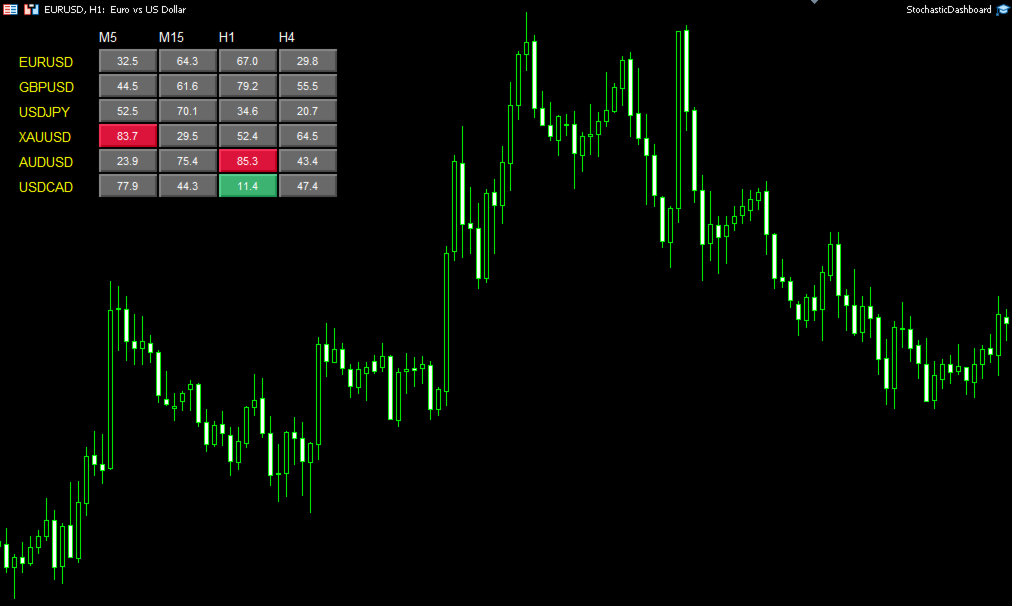
Stop wasting time switching between 20 charts!
Stochastic Dashboard Pro is a professional multi-currency scanner that monitors the market for you. It tracks Overbought and Oversold conditions across multiple pairs and timeframes simultaneously.
Key Features:
- Multi-Currency Scanning: Monitors 6 major pairs (customizable) on M5, M15, H1, and H4 timeframes.
- One-Click Navigation: Click on any signal button to instantly open the corresponding chart.
- Visual Signals: Green = Oversold (Buy), Red = Overbought (Sell), Grey = Neutral.
- Performance: Highly optimized code, lightweight for your terminal.
How to use:
1. Attach the EA to ONE chart only (e.g., EURUSD H1).
2. Wait 10-30 seconds for data to load.
3. Click the colored buttons to open charts and trade.
Note: On the first launch, allow some time for history synchronization.
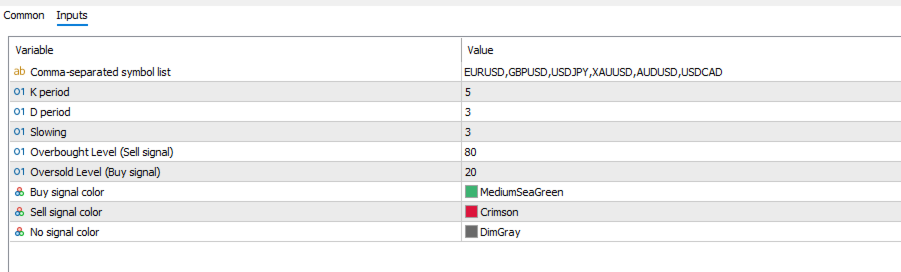
Settings:
- Symbols: List of pairs to scan (e.g. EURUSD,GBPUSD,USDJPY).
- Stochastic Settings: K, D, Slowing periods.
- Overbought/Oversold Levels: Customize your trigger zones (e.g. 80/20).