Volume Weighted ATR MT5 Indicator by PipTick
- Indicatori
-
Michal Jurnik
 "Talent is cheaper than table salt. What separates the talented individual from the successful one is a lot of hard work." - Stephen King. Those few words reflect myself very well. I am probably not the most talented developer in the world but I truly believe in hard work, professional attitude and
 - Versione: 1.2
- Aggiornato: 3 dicembre 2021
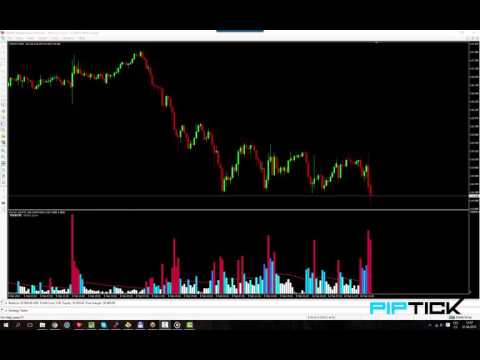
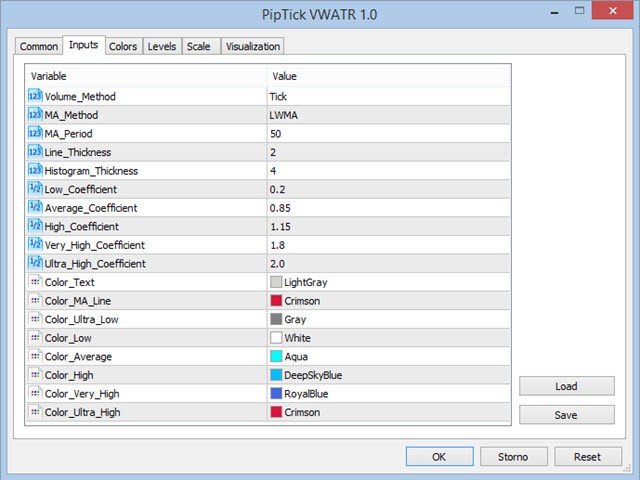
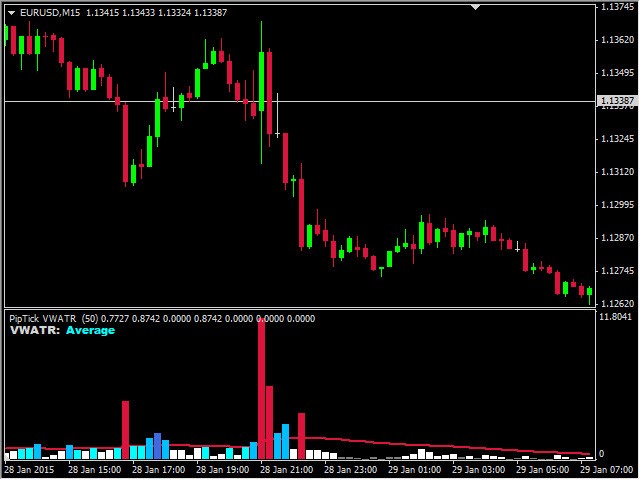
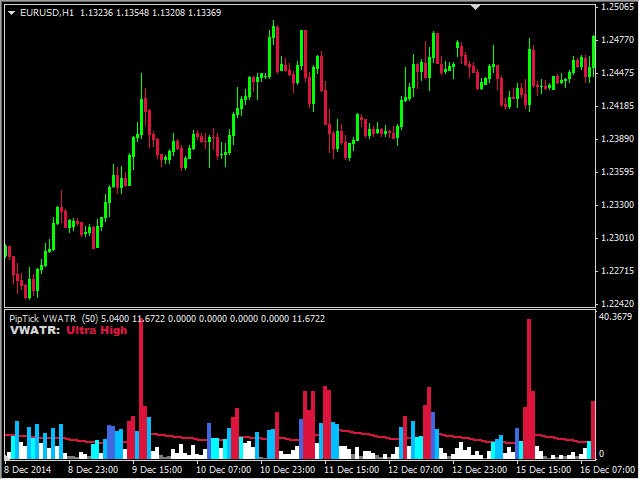
The Volume Weighted ATR indicator is a helpful tool for measuring market activity. It is based on the idea of the Volume-Weighted ATR. Combining these two elements helps identify potential turning points or breakout opportunities. The indicator for the classification of the activity of the market uses the moving average and its multiples. Accordingly, where the VWATR bar is located (relative to the moving average), it is labelled as ultra-low, low, average, high, very high or ultra high. The Volume Weighted ATR indicator is rendered as a histogram.
This indicator can calculate the moving average by four methods:
- SMA - Simple Moving Average.
- SMMA - Smoothed Moving Average.
- EMA - Exponential Moving Average.
- LWMA - Linear Weighted Moving Average.
Interpretation
By default, there are six zones that can be changed by the user. Depending on which zone corresponds to the Volume Weighted ATR indicator, the histogram bar is colored by the appropriate color.
- Ultra VWATR zone - Crimson.
- Low VWATR zone - White.
- Average VWATR zone - Aqua.
- High VWATR zone - DeepSkyBlue.
- Very High VWATR zone - RoyalBlue.
- Ultra High VWATR zone - Blue.
Main features
- A simple classification of the activity of the markets.
- Several optional calculation methods.
- Real and tick volume calculation.
- User selectable ranges of the zones.
- Works on every timeframe (M1, M5, M15, M30, H1, H4, D1, W1, MN).
- A very fast and reliable indicator.
- Customizable parameters (Colors, Line thickness, MA period...).
- It can be used for creating EA (Expert Advisor).
- Available for MT4 and MT5.


Great Indicator. Also because it is free. It goes on every chart for me. What I really like are the clear spikes that I can see. I do miss a level alert. Thank you.