Trend Detector Monitor
- Indicatori
- Francisco De A Vilar Enriquez
- Versione: 1.2
- Aggiornato: 4 dicembre 2025
- Attivazioni: 5
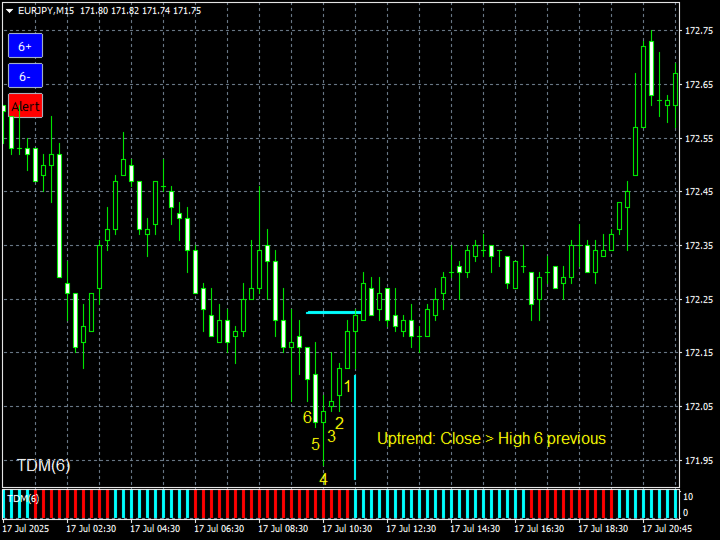
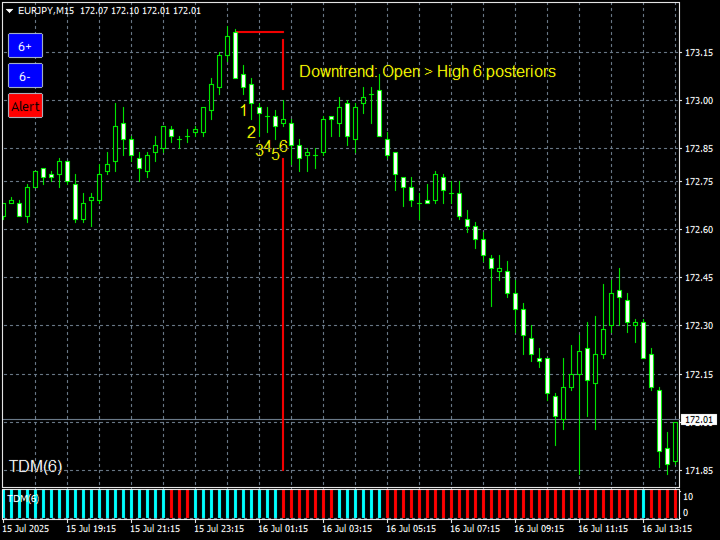
It's a very convenient and easy to use indicator, as well as powerful and accurate. It detects and visually displays the start of a new trend. It is presented in a two-color bar chart: one for the start of an uptrend and one for the start of a downtrend. The indicator only requires the number of bars to look at for its calculation.
Calculation.
a) The indicator compares the current candlestick close with the high or low of the previous candle group. If it's higher than the high, it indicates an uptrend; if it's lower than the low, it indicates a downtrend.
b) The indicator compares the previous open with the high or low of the subsequent candlestick group. If it's higher than the high, it indicates a downtrend; if it's lower than the low, it indicates an uptrend.
Features:
The PERIOD parameter is the number of candlesticks for the calculation.
It has the option to activate the new trend alert with an alert control.
For any time frame.
By default, it uses the color aqua for the start uptrend, and red for the start downtrend.
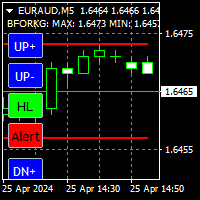
Blue controls.
Associated with the PERIOD parameter.
Alert Control.
Allows you to activate/deactivate the alert of new trend. It turns Yellow when activated.
Alerts are of two types: 1) Possible new trend. 2) New trend detected.
Indicator adjustment.
For the indicator to be useful, it is necessary to adjust it to the price, modifying it with the controls until it does not show bar changes in the sections of interest. Once established, it will be set in the PERIOD parameter box.
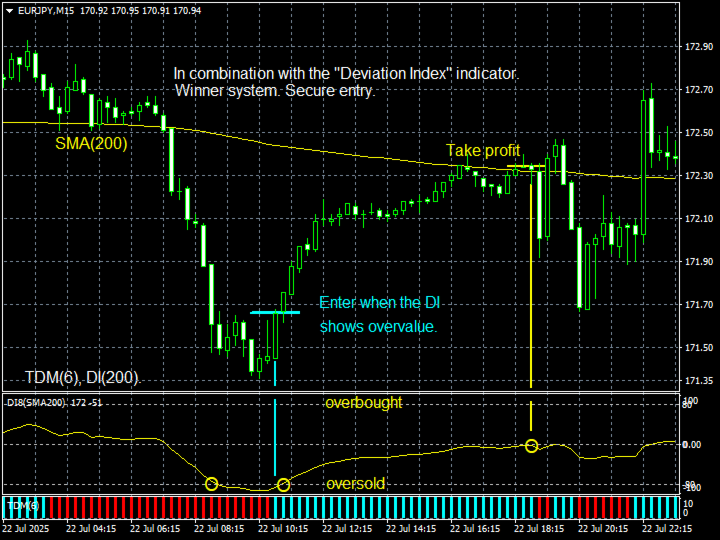
Recommended indicators: The Oscillometer, Deviation Index, Fork
Contact email: fve2022@hotmail.com

