NAM Divergences
- Indicatori
-
NAM TECH GROUP, CORP.
 NAM Tech is born in the effort of unifying professional traders needs and premium development technology. With many years of experiencie we have achieved to bring the best user experiencie in all of our products.
 - Versione: 1.5
- Aggiornato: 16 maggio 2021
- Attivazioni: 10
MT4 Multi-timeframe Divergence and Overbougt/Oversold detection indicator.
Features
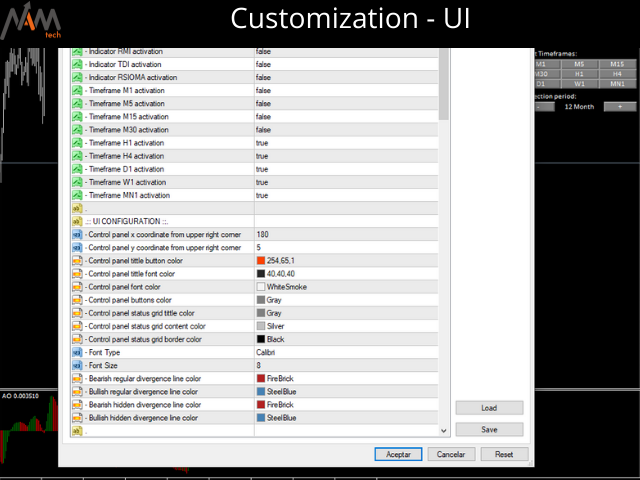
- Fully customizable on chart control panel, provides complete interaction.
- Hide and show control panel wherever you want.
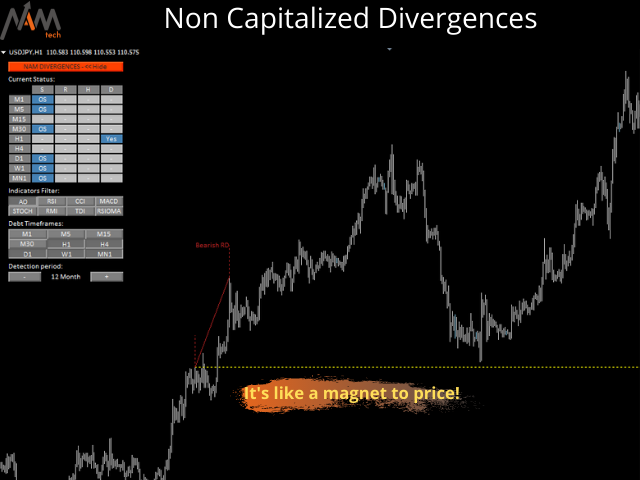
- Real time information about non-capitalized divergences.
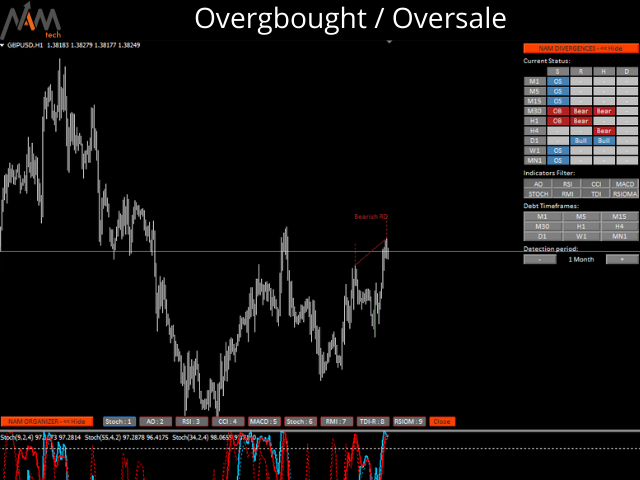
- Real time information about overbougt / oversold situations.
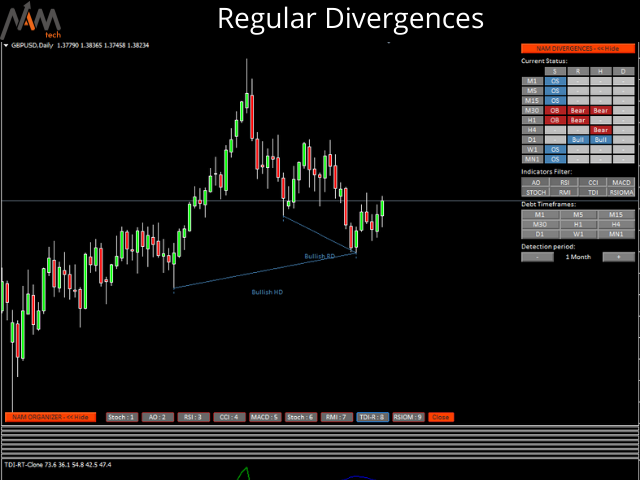
- Real time information about regular divergences.
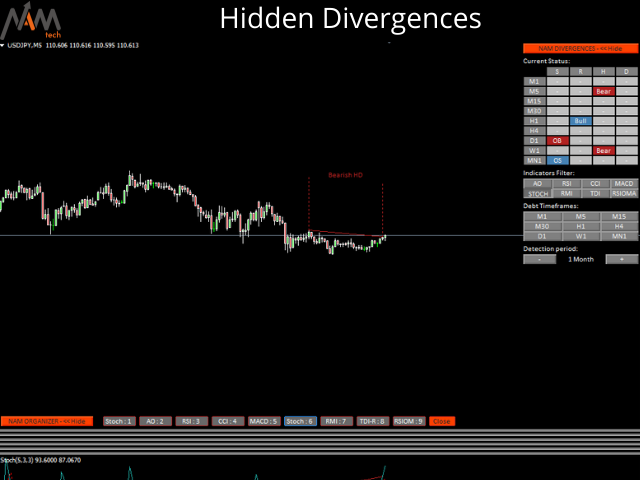
- Real time information about hidden divergences.
- Oscillators available for divergences detection: AO, RSI, CCI, MACD, STOCH, RMI, TDI, RSIOMA.
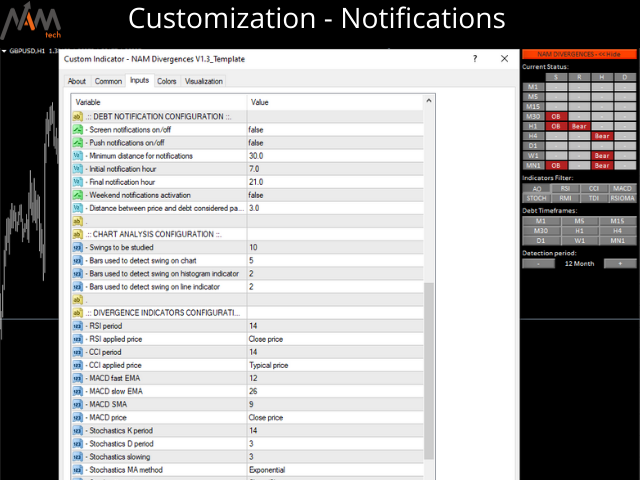
- Notification service (Screen alerts | Push notifications).
Summary
Using divergence trading can be useful in spotting a weakening trend or reversal in momentum. Sometimes you can even use it as a signal for a trend to continue. Our tool offers divergence detection on all timeframes simultaneously, in an amazingly comfortable and intuitive control panel with the possibility of show and hide, to keep your chart as clean as possible.
You will see at real time overbought and oversold situations, regular divergences, hidden divergences and uncapitalized divergences on the history period of choice.
For uncapitalized divergences we have on-screen notifications on MT4 and push notifications to your mobile phone!

Muy completo y preciso... una pieza de relojería