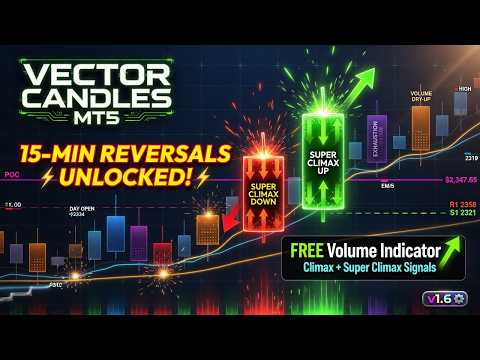
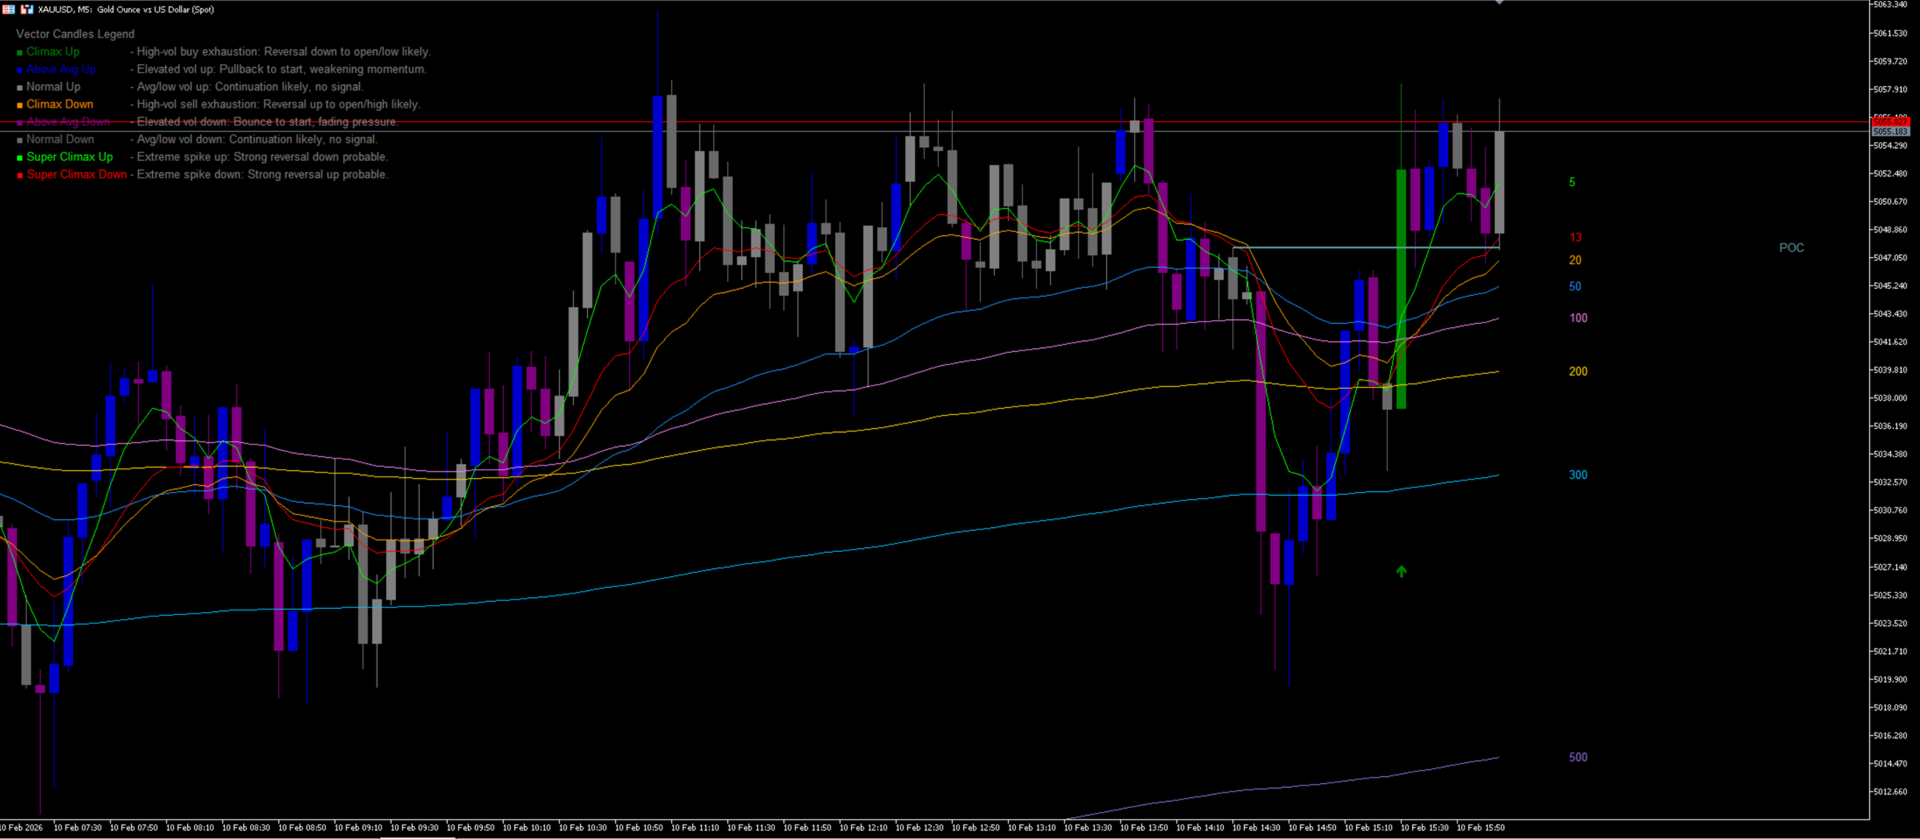
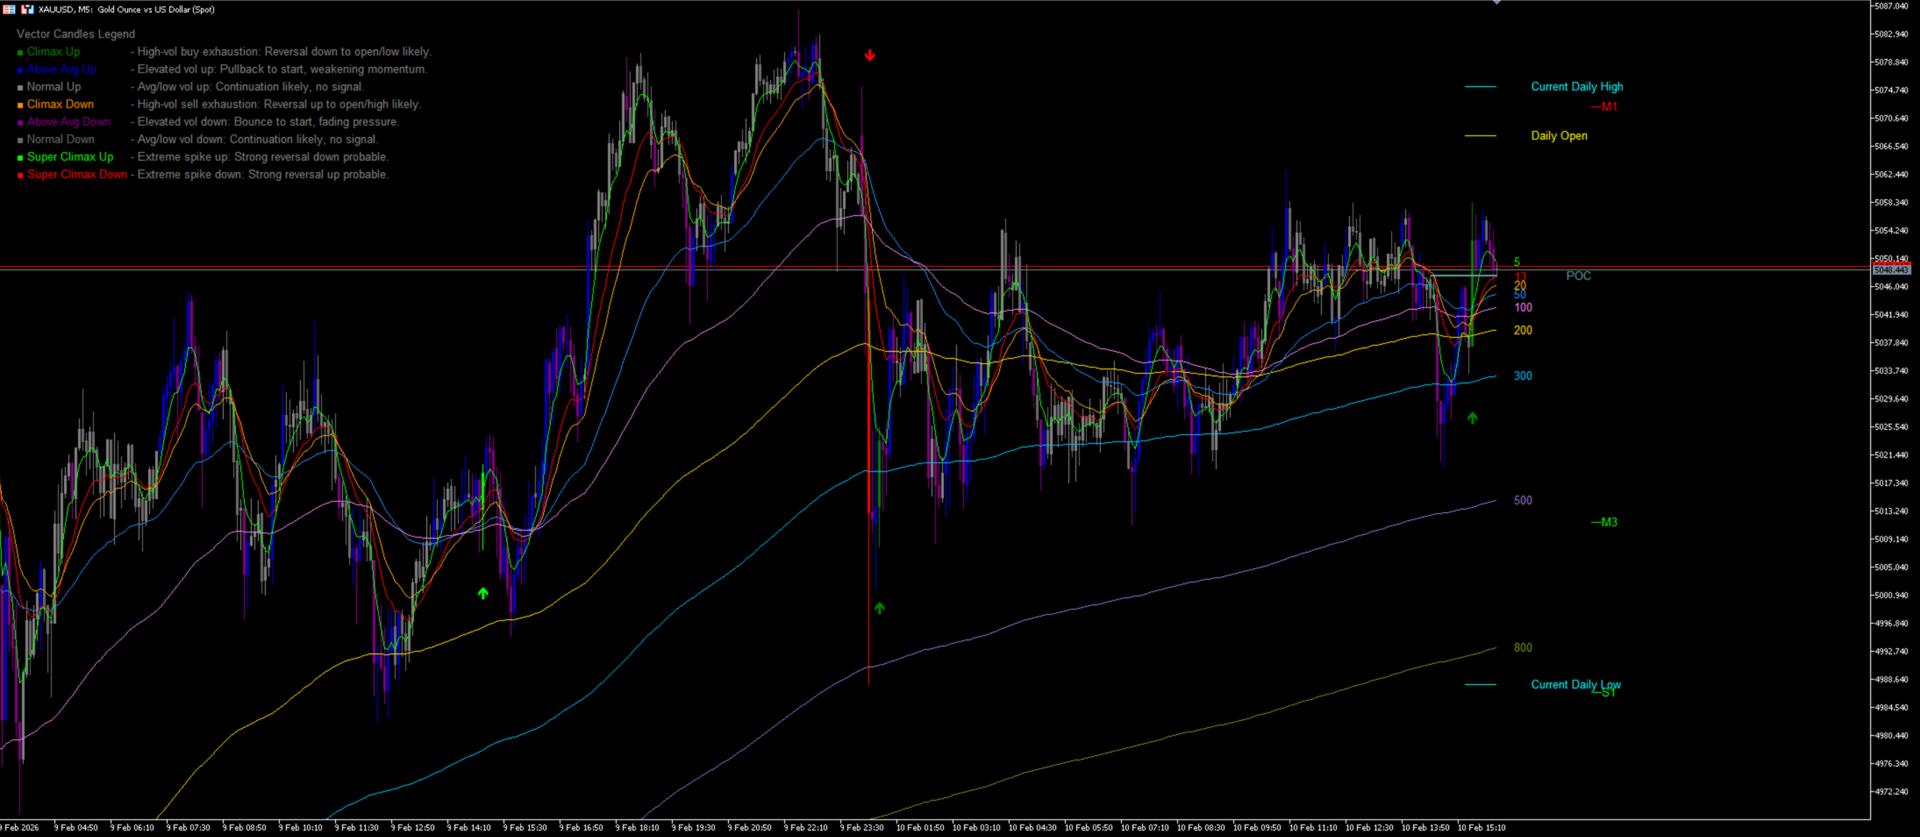
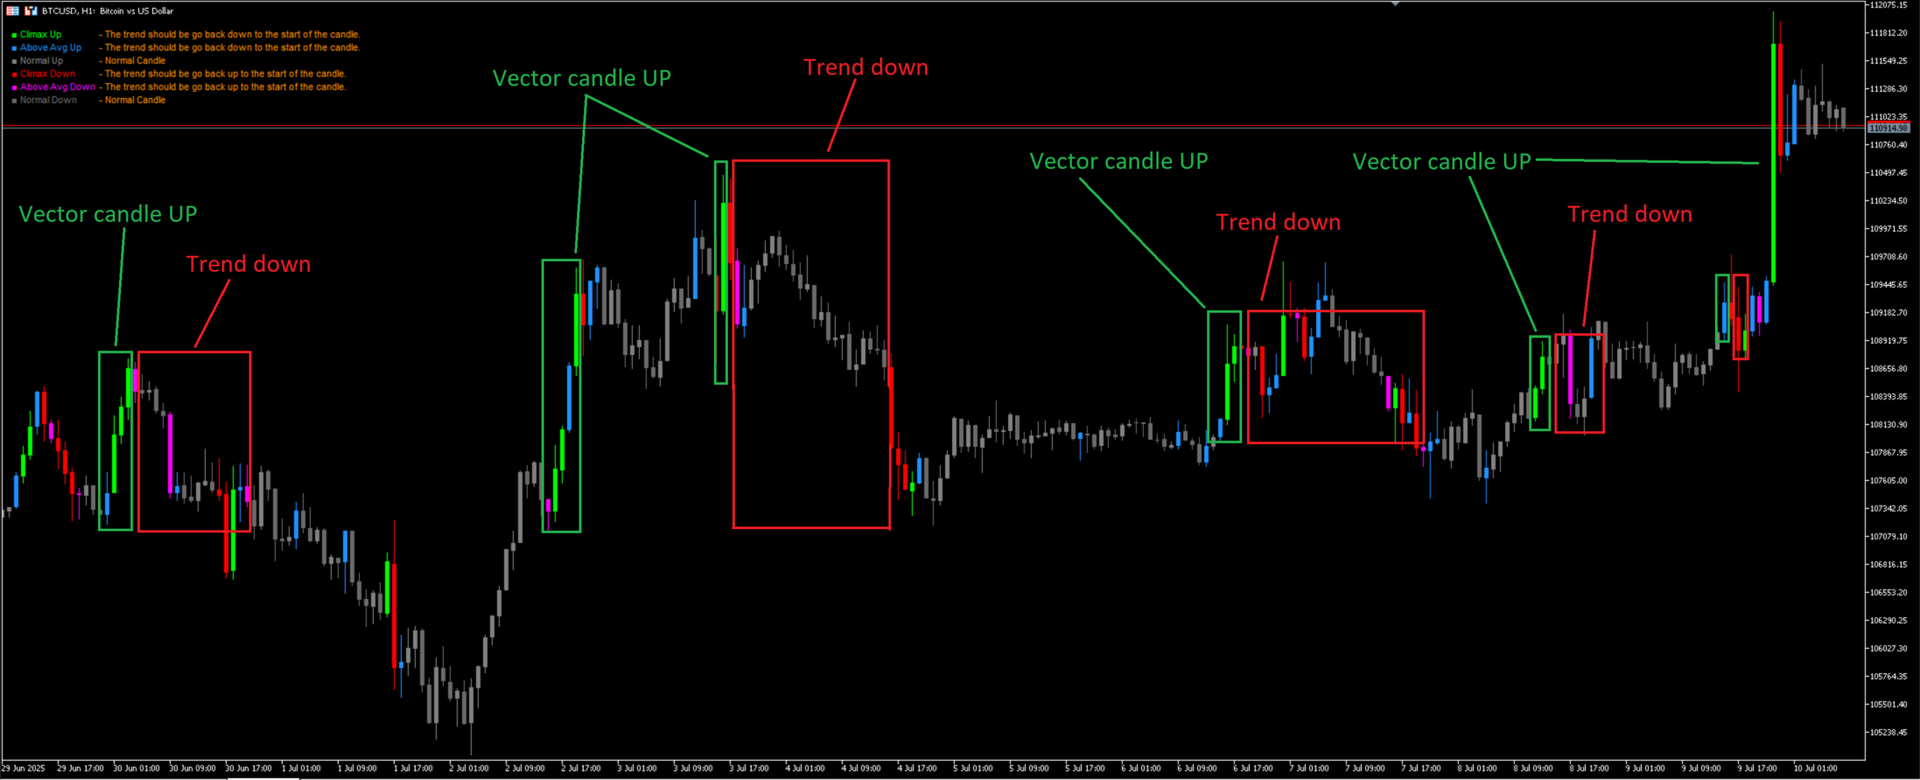
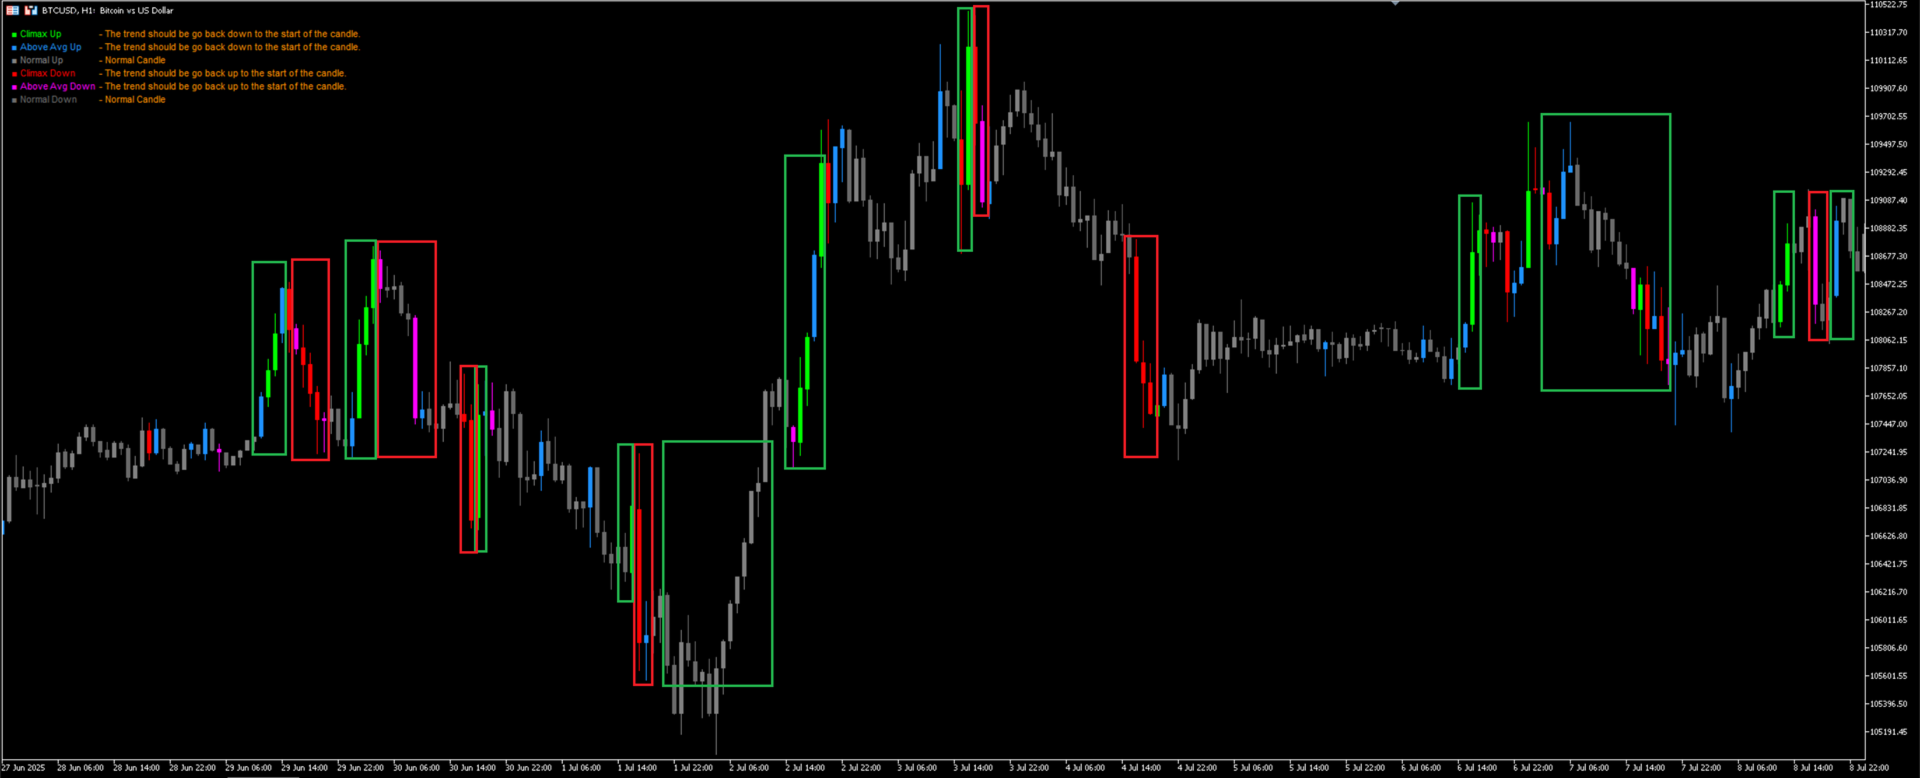
Vector Candles Indicator
- Indicatori
- Versione: 1.7
- Aggiornato: 11 giugno 2026

Vector Candles Indicator
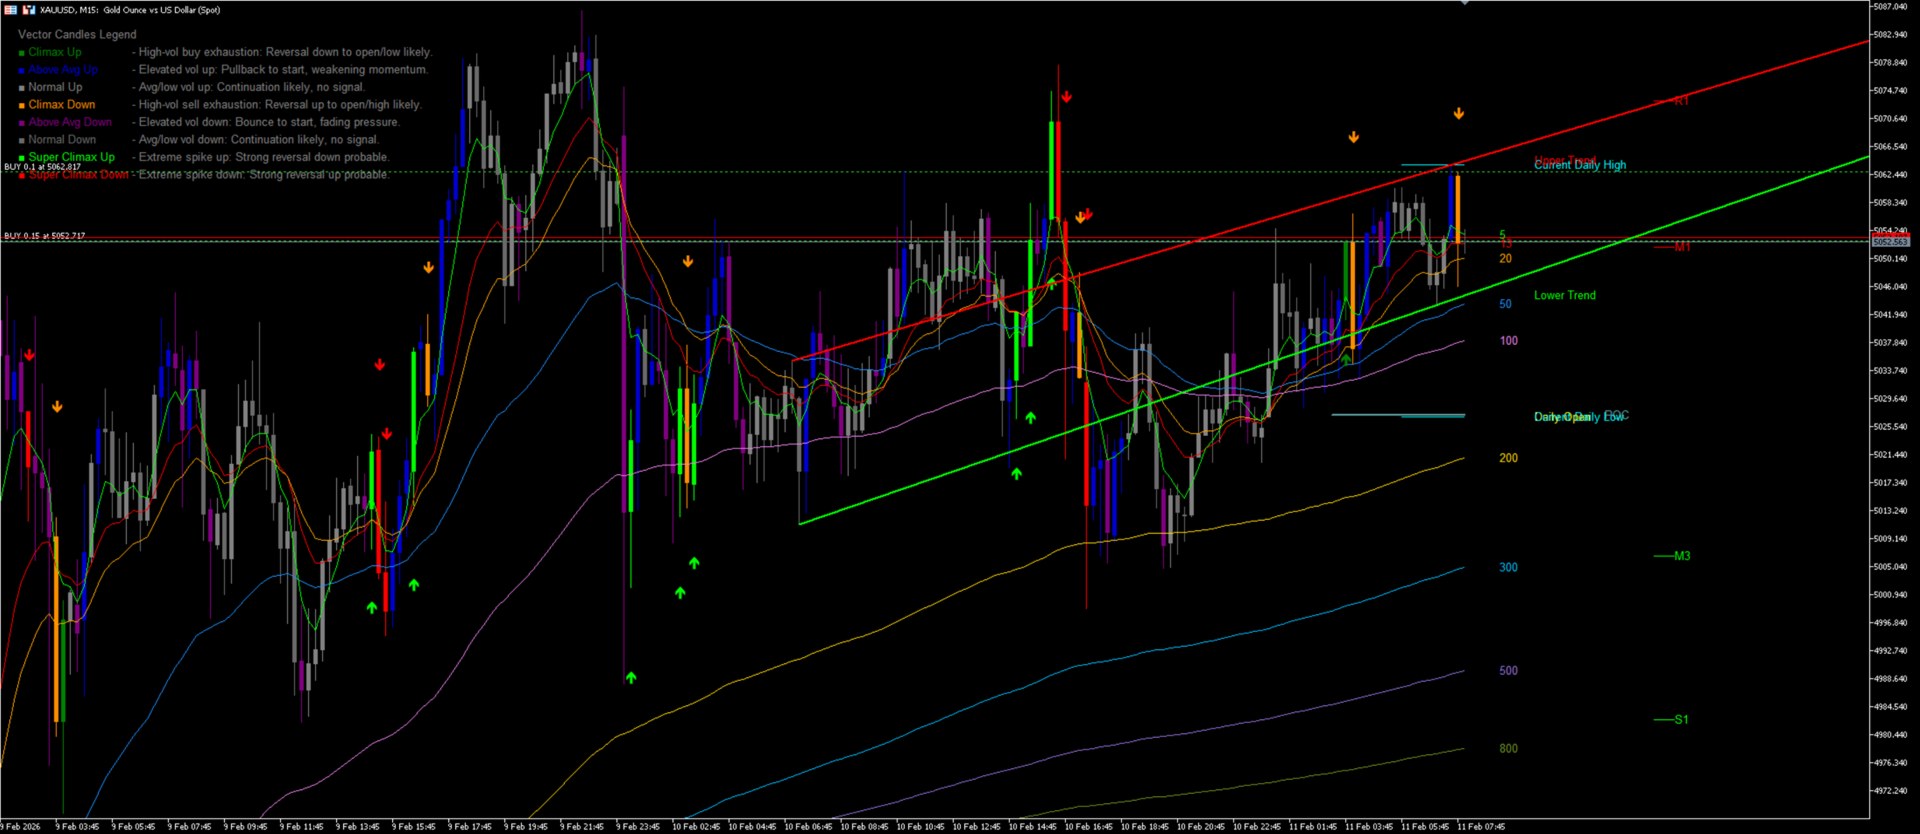
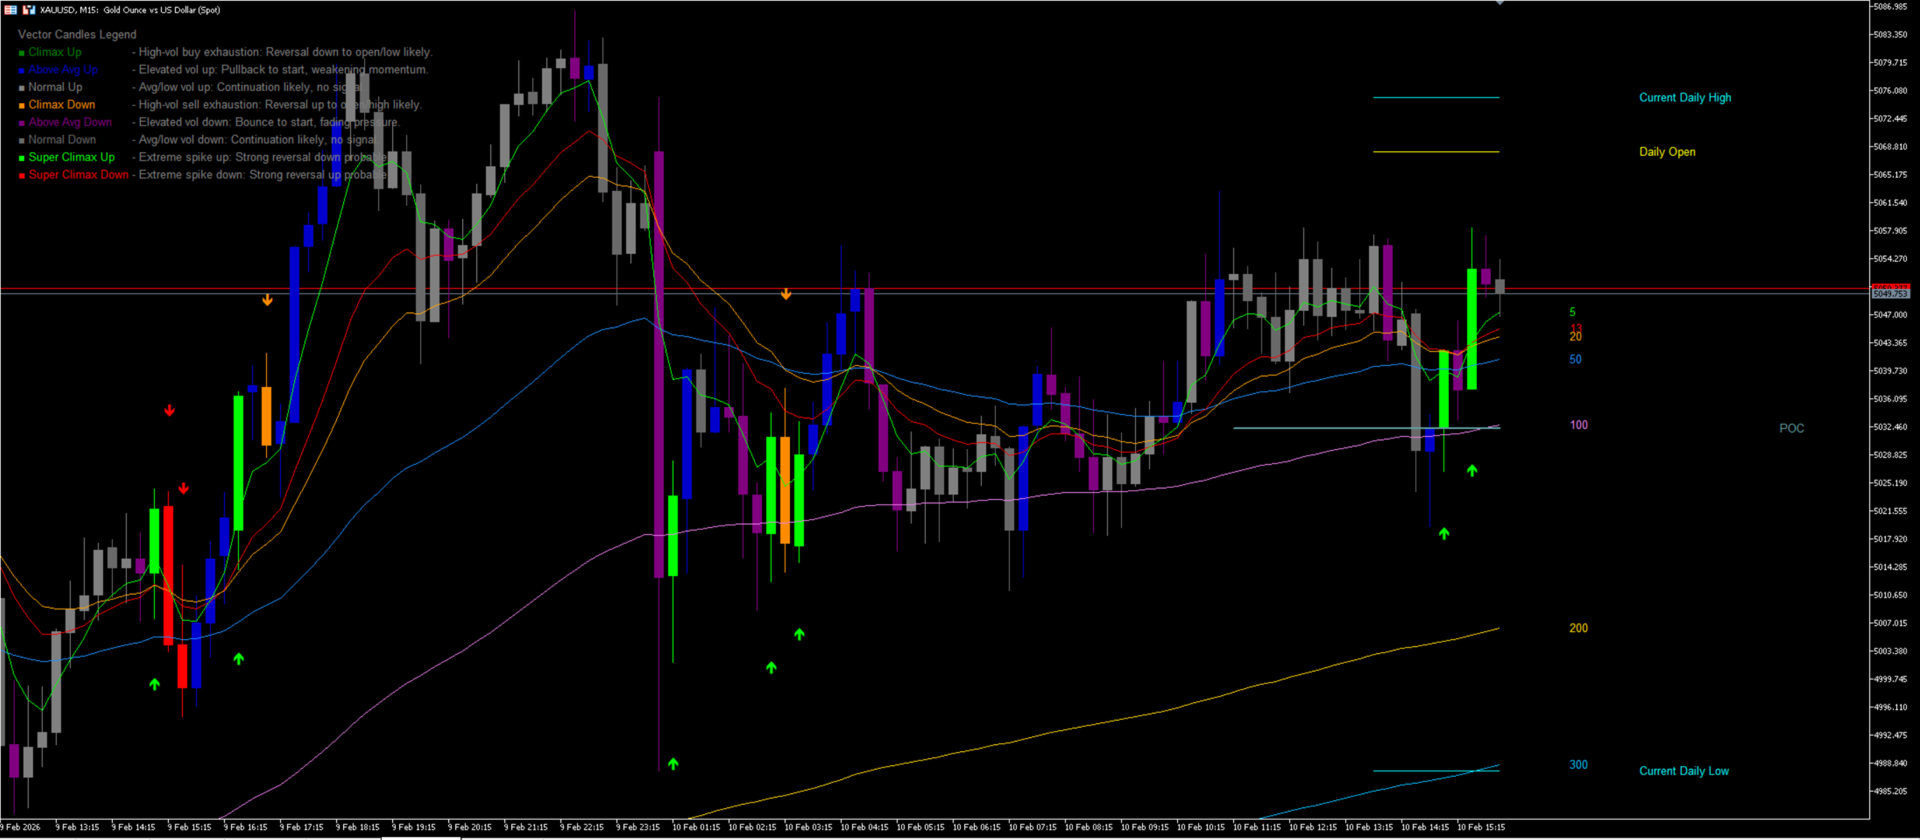
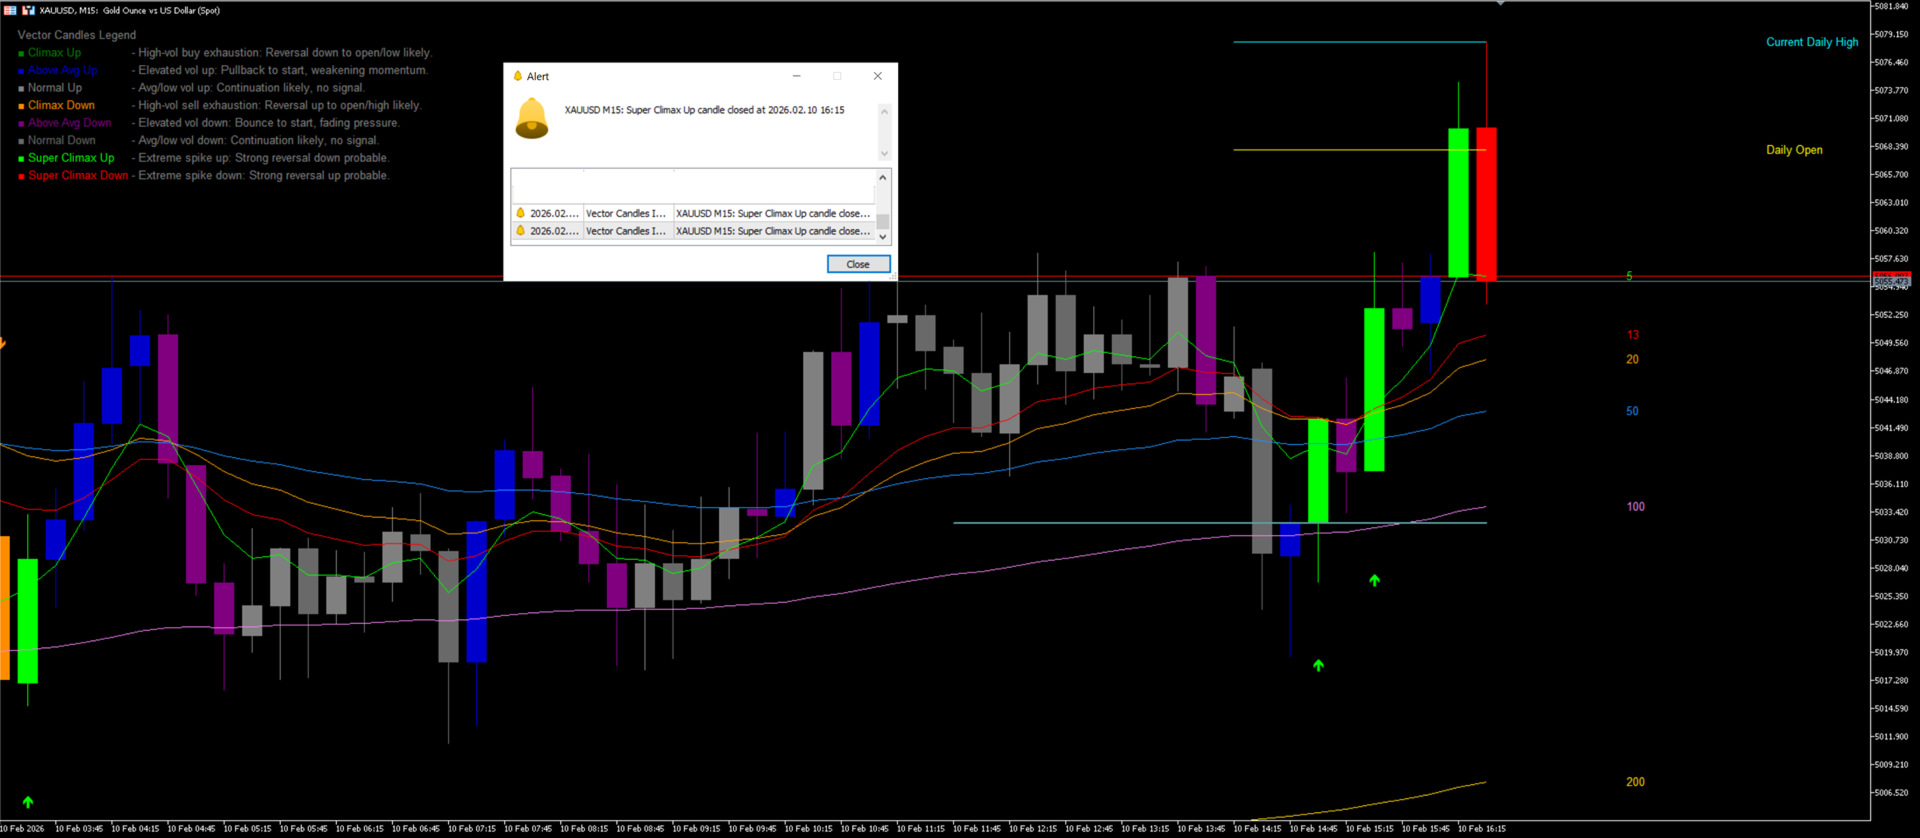
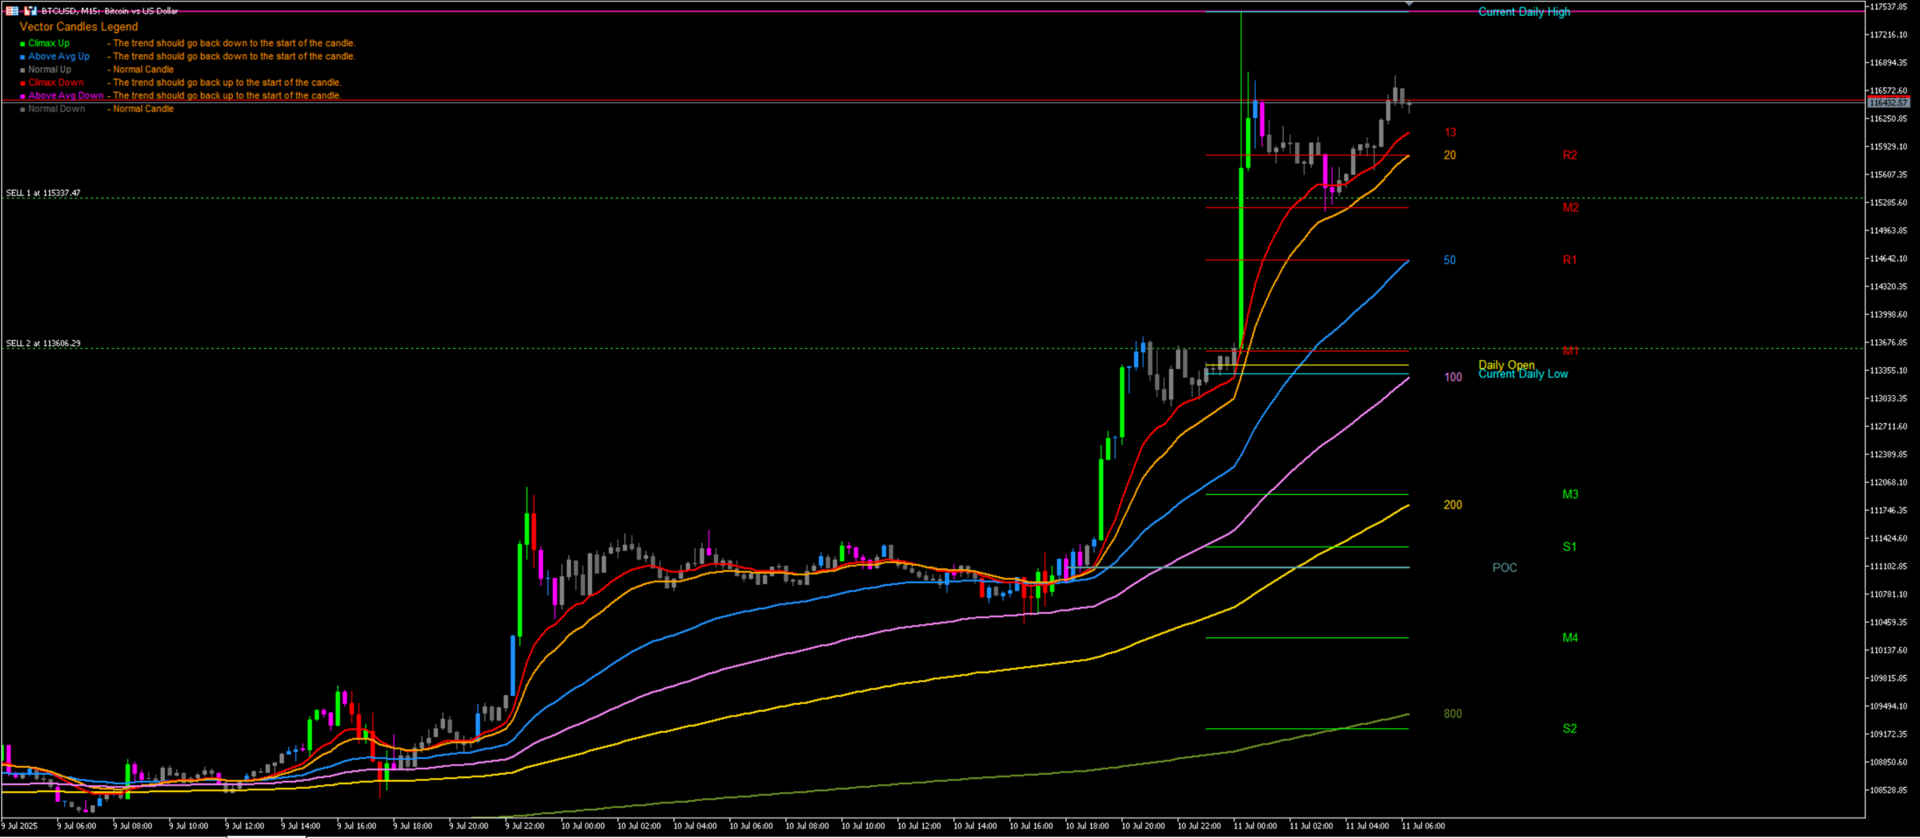
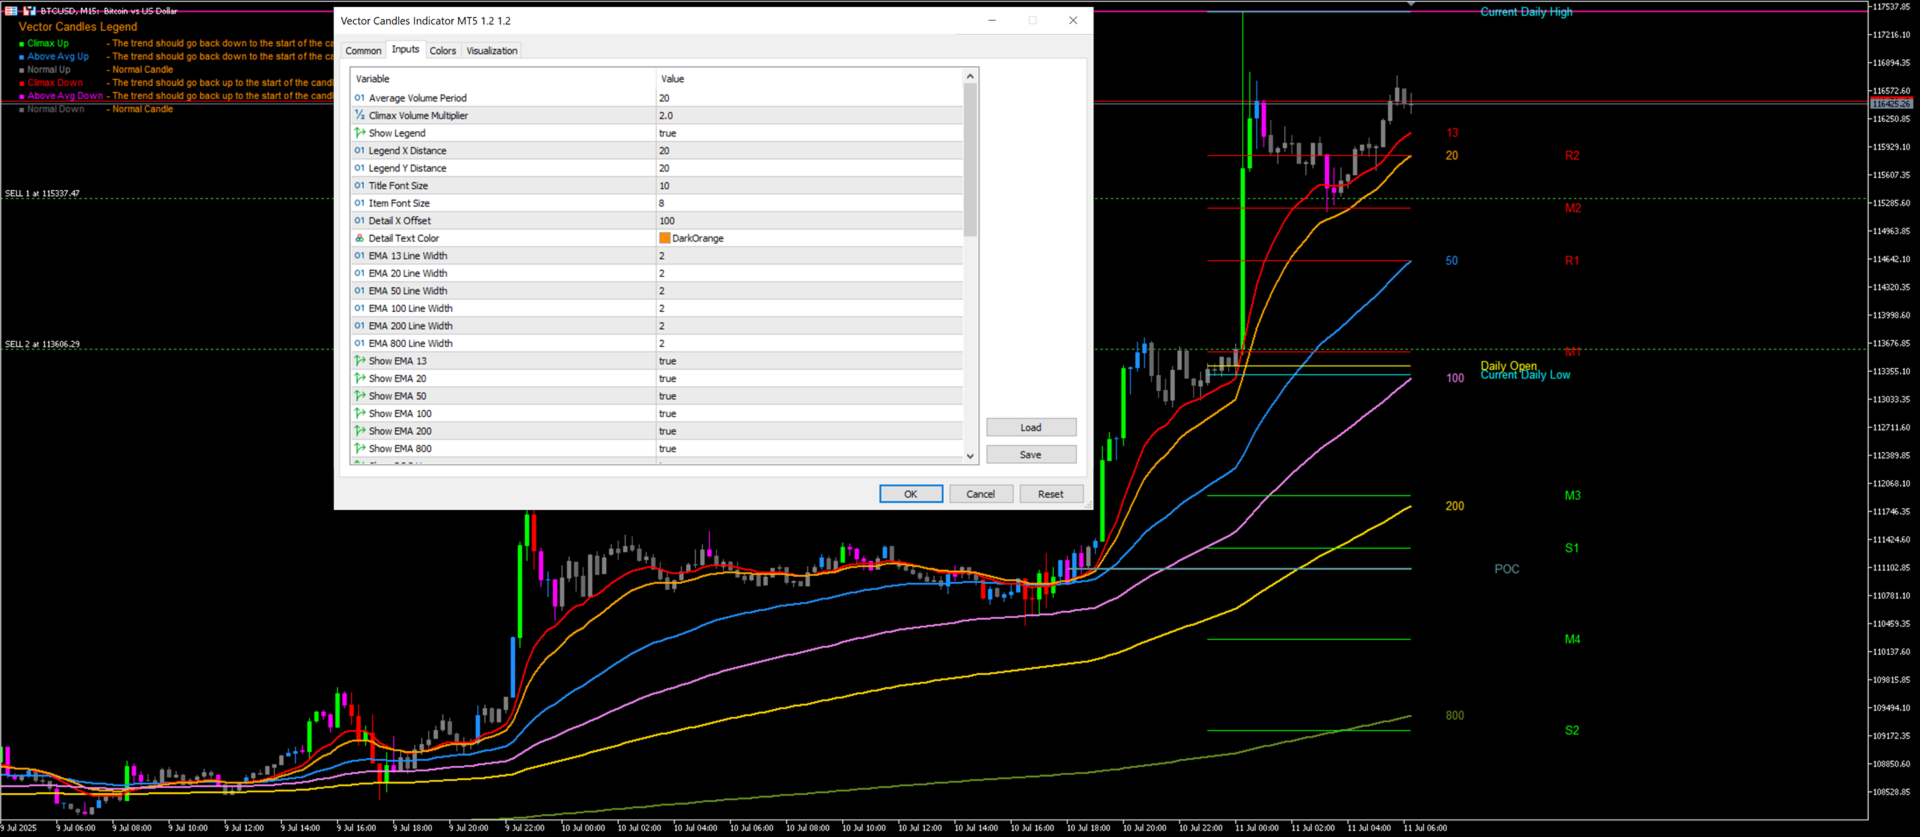
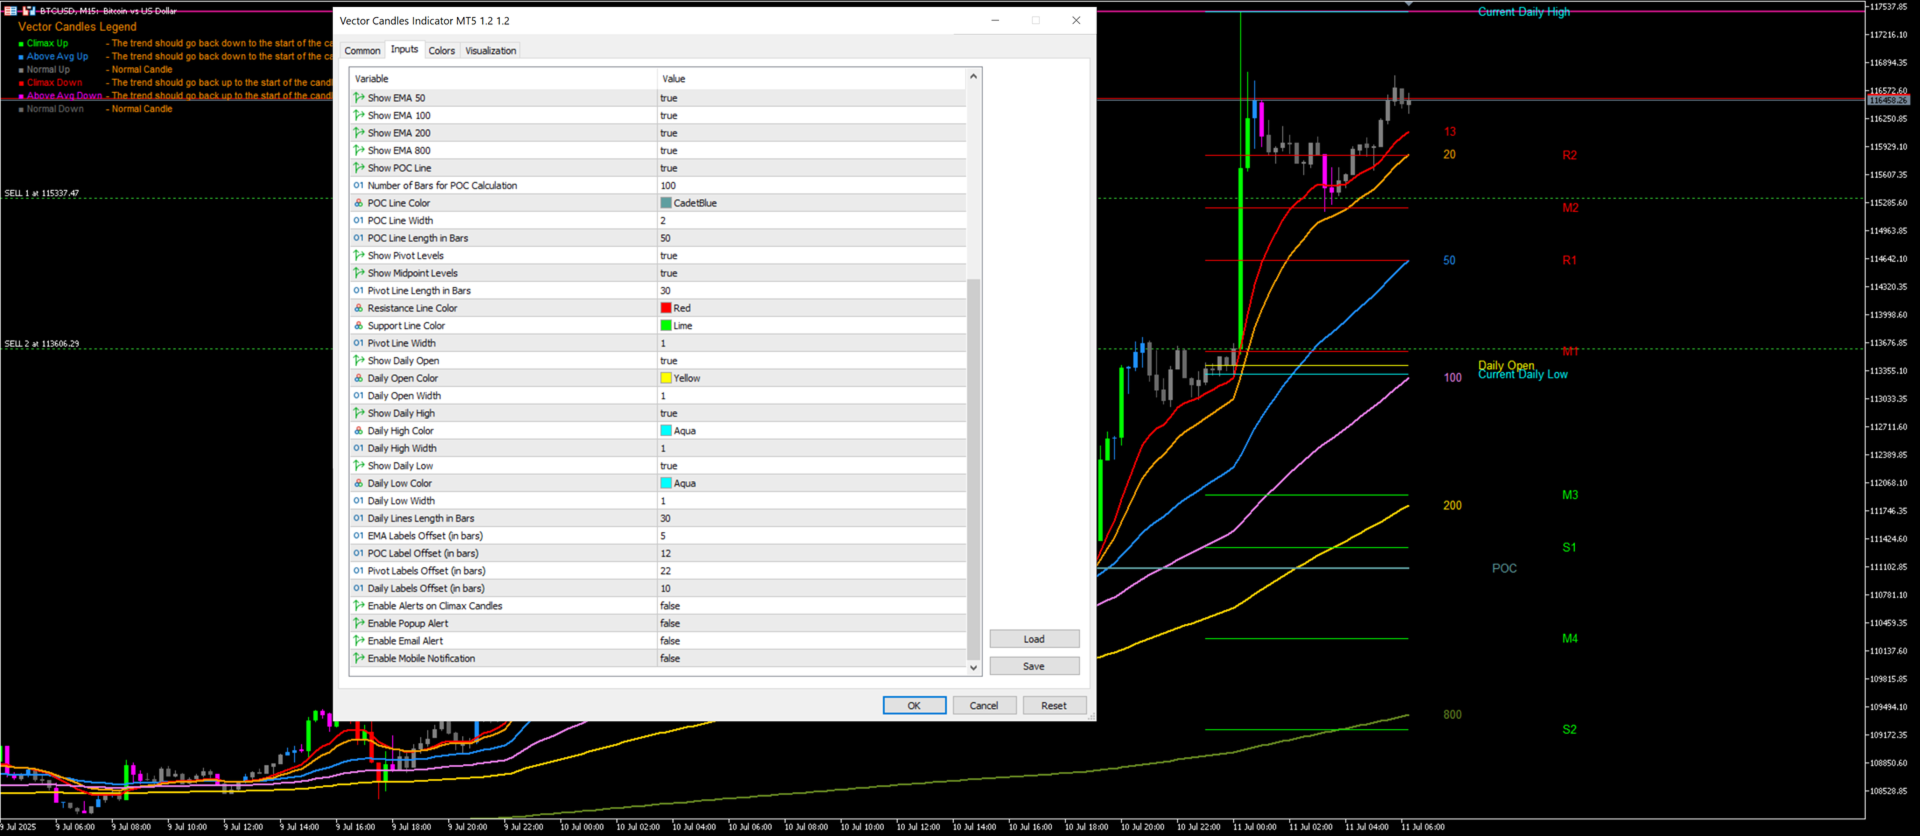
Vector Candles Indicator is a powerful MT5 tool designed for traders seeking advanced volume analysis and trend insights. It colors candles based on tick or real volume to highlight climax (exhaustion) and super climax (extreme spike) patterns, signaling potential reversals or continuations. Integrated features include 9 customizable EMAs (5-800 periods), Point of Control (POC) from volume profiles, daily pivot levels with midpoints, current day open/high/low lines, arrows for key candles, and configurable alerts (sound, email, push). A built-in legend explains color meanings for quick interpretation. Fully adjustable via inputs for volume thresholds, visibility, and more—ideal for forex, stocks, and crypto on any timeframe. Elevate your trading with dynamic, data-driven visuals!
Recommended time frame M15
Detailed setup: Check https://www.mql5.com/en/blogs/post/763327
Support and questions via MQL5 product comments.
For questions, updates, and to connect with other traders, join my official MQL5 group ForexEAandMore
In the Vector Candles Indicator, climax candles are highlighted based on volume thresholds to signal potential exhaustion or reversals. Here's a breakdown of the climax-related colors and their meanings (as per the on-chart legend):
- Climax Up (Green): Represents high-volume buying exhaustion on an up candle (close > open). It suggests a likely reversal downward toward the candle's open or low.
- Climax Down (Dark Orange): Indicates high-volume selling exhaustion on a down candle (close < open). It points to a potential reversal upward toward the candle's open or high.
- Super Climax Up (Lime): Shows an extreme volume spike on an up candle, implying a strong probable reversal downward.
- Super Climax Down (Red): Denotes an extreme volume spike on a down candle, signaling a strong probable reversal upward.
These are detected using average volume multipliers (dynamic or manual), with optional filters like minimum volume and candle body size. Arrows can also appear in matching colors for emphasis.
Settings
Volume Calculation Settings
Alert Settings
Legend Display Settings
EMA Line Width Settings
EMA Visibility Settings
POC Settings
Pivot Levels Settings
Daily Lines Settings
Label Offset Settings
Arrow Settings
Disclaimer
This indicator is provided for informational purposes only and does not constitute financial advice. Past performance calculated using historical data does not guarantee future results, and trading involves risk of loss. Always test the product in a demo account, combine it with appropriate risk management, and consult a professional advisor if necessary. The developer assumes no liability for any trading decisions made based on this tool. Translations are available via MQL5 tools for global accessibility.

GREAT INDICATOR DEF TRY IT