ATR Pyramid

ATR Pyramid 🏔️: Il tuo biglietto per accumulare profitti più alti di una torre di Jenga sotto steroidi 🗼💪, trasformando la volatilità del mercato in una festa di surf sulle tendenze 🏄‍♂️ e di aggiunta di posizioni 🎉, dove solo il primo trade rischia un wipeout 🌊, mentre proteggi il resto facendo scorrere il tuo stop loss verso l'alto come un ascensore 🛗, creando una zona di comfort che è l'unica vera via per moltiplicare il tuo conto forex più velocemente di un coniglio sotto espresso!!! ☕🐰💨

Attenzione a tutti voi accumulatori di profitti e surfisti di tendenze! 📢🏄‍♂️ Questo indicatore ATR Pyramid è per quelli di voi che amano costruire piramidi finanziarie (del tipo legale, lo promettiamo 😉).

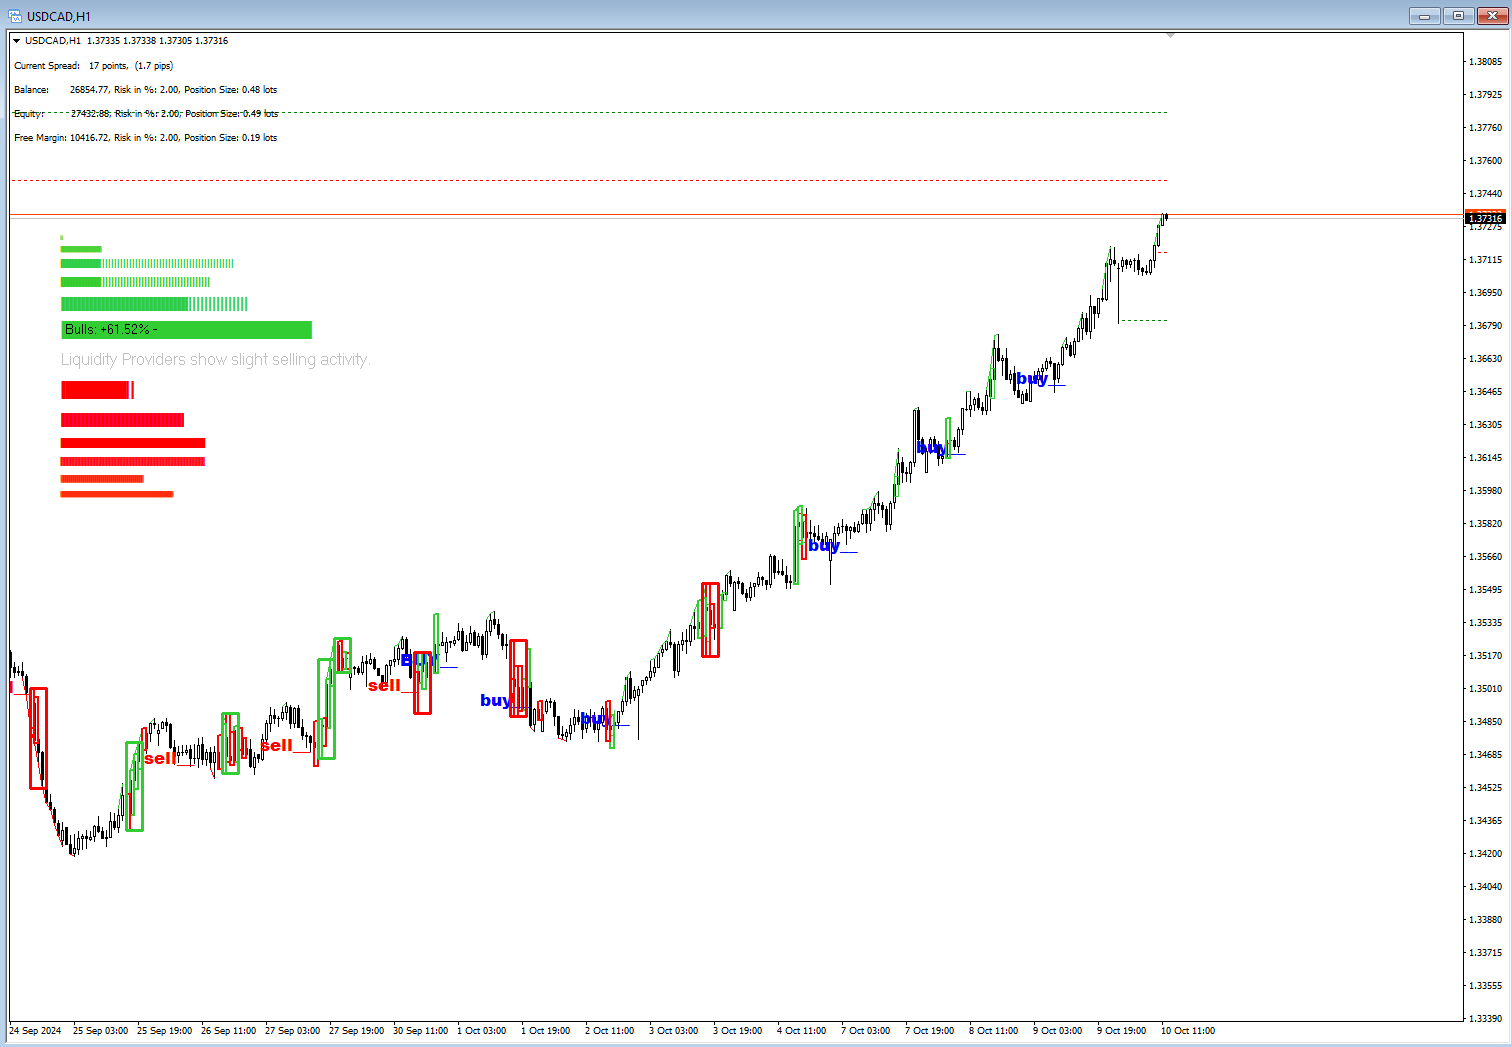
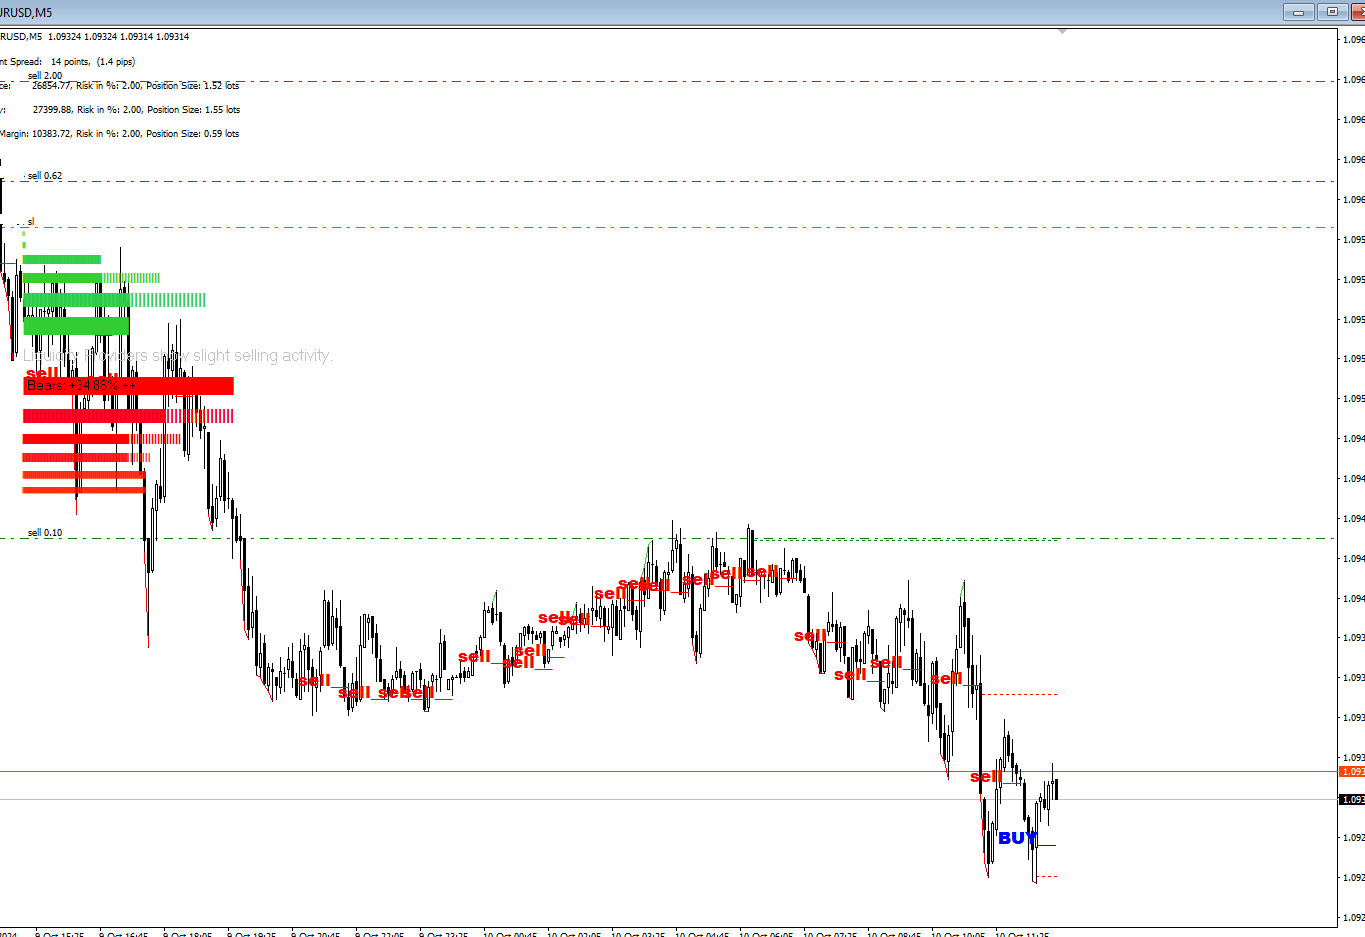
Sai come dicono che l'ATR mostra solo la volatilità del mercato? 📊 Beh, colpo di scena - non è tutta la storia! 🎭 Questo astuto strumentino può in realtà fiutare la direzione del trend più velocemente di un segugio in preda alla caffeina. 🐕☕ E indovina un po'? Lo stiamo usando per accumulare quei profitti come se fosse un buffet all-you-can-eat. 🍽️💰

Ma aspetta, c'è di più! 🎩✨ Per costruire una piramide magnifica come quella di Giza, o addirittura più alta, ti consigliamo di verificare cosa stanno facendo i più grandi Market Maker. Come? Con l'indicatore Glimpz da glimpz.net! 🕵️‍♂️🌐 È come avere una finestra segreta sulla mente dei giganti del mercato. Non fare trading contro corrente, cavalca l'onda con i pesci grossi! 🐳🏄‍♂️

Immagina questo: Non stai solo cavalcando il trend, ci stai costruendo sopra un grattacielo. 🏗️ Ogni piano? Una nuova posizione aggiunta alla tua serie vincente. 📈 È come giocare a Jenga al contrario - più sali in alto, più diventa stabile! 🧱🔄

Ricordate, amici: La piramide dei profitti è l'unico modo per far crescere il vostro capitale mantenendo le perdite a dieta stretta. 💪💰 Se giocate bene le vostre carte, solo la vostra prima posizione flirterà con il rischio di perdita. 🃏 È come avere un pedone sacrificale in una partita di scacchi, solo che questo pedone potrebbe trasformarsi in una regina. ♟️👑

Quindi, guidate le vostre piramidi con saggezza, trader. Non costruitele più alte della Torre di Pisa, e sicuramente non lasciate che si inclinino così tanto. 🗼⚖️ E con Glimpz al vostro fianco, costruirete il vostro impero di trading su basi solide! 🏛️💼

Felice piramidazione, pazzi architetti del profitto! 🏗️🤪 Che i vostri trend siano sempre a vostro favore, e che i vostri profitti si accumulino più in alto di un panino in una gastronomia di New York!!! 🥪🗽💰


Prodotti consigliati
MQLTA Support Resistance Lines is an indicator that calculates the historical levels of Support and Resistance and display them as Lines on chart. It will also Alert you if the price is in a Safe or Dangerous zone to trade and show you the distance to the next level. The indicator is ideal to be used in other Expert Advisor through the iCustom function. This DEMO only works with AUDNZD, the full product can be found at https://www.mql5.com/en/market/product/26328 How does it work? The indicator
FREE
Session Shade
Shunsuke Kanaya
Session Shade (MT4) – Non-Trading Hours Background Shading Overview Session Shade is a lightweight MT4 chart utility indicator that visually highlights non-trading hours by shading the chart background. It is designed to help you confirm your daily time-filter window at a glance. This is a visualization tool only. It does not generate trading signals and it does not place, modify, or close any orders. Key features Shades non-trading hours (NG) on the chart background Keeps trading hours (OK) cl
FREE
MQLTA Support Resistance Lines
MQL4 Trading Automation
4.27 (11)
MQLTA Support Resistance Lines is an indicator that calculates the historical levels of Support and Resistance and display them as Lines on chart. It will also Alert you if the price is in a Safe or Dangerous zone to trade and show you the distance to the next level. The indicator is ideal to be used in other Expert Advisor through the iCustom function. This indicator can be tested LIVE on AUDNZD with the following DEMO https://www.mql5.com/en/market/product/26572 How does it work? The indicato
FREE
Round Number By Pips
Nguyen Thanh Sang
5 (2)
Indicator draws Round Number lines by distance of pips. 1. You can enable / disable indicator to show / hide the lines. 2. You can set distance of pips between the lines. 3. You can edit the number of lines.  4. You can edit properties of lines by inputs (style (DASH, DOT, SOLID, ...) , width (1 for DASH, DOT, 2 is not for DASH, DOT, it only SOLID), color). When indicator is deleted from the chart, the lines will be removed.
FREE
The selective pin bar is designed to identify reversals. To use the selective pin bar effectively, traders typically look for Strong Rejection: The tail of the pin bar should extend significantly beyond the surrounding price action. It indicates that there was a sharp rejection of higher or lower prices during the trading period. A strong rejection suggests that the market sentiment may be changing.
FREE
Show Pips
Roman Podpora
4.26 (58)
Questo indicatore informativo sarà utile per coloro che vogliono essere sempre informati sulla situazione attuale del conto. L'indicatore mostra dati come profitto in punti, percentuale e valuta, nonché lo spread per la coppia corrente e il tempo fino alla chiusura della barra nell'intervallo di tempo corrente. VERSIONE MT5 -   Indicatori più utili Esistono diverse opzioni per posizionare la linea delle informazioni sulla carta: A destra del prezzo (corre dietro al prezzo); Come commento (nell'
FREE
The indicator is a multifunctional tool for automating the analysis and visualization of the trading process. Main features: News display — the indicator automatically loads and displays economic news on the chart, allowing you to take into account important events when trading. Dynamic timeframe change — during the news release, the chart switches to a preset period for more detailed analysis. Adapting to the number of orders — the timeframe can change automatically depending on the number of
FREE
This indicator is stand alone version from  MP Pivot Levels  (All in one) containing Woodie Pivots. Woodie’s pivot points are made up of multiple key levels, calculated from past price points, in order to frame trades in a simplistic manner. The key levels include the ‘pivot’ itself, and multiple support and resistance levels (usually up to three each). Traders use these levels as a guide for future price movements when setting up trades. The pivot : (Previous high + previous low + 2 x previous
FREE
MP Demark Pivot Levels
Pierre Ksachikian
4 (1)
This indicator is stand alone version from  MP Pivot Levels  (All in one) containing Demark's Pivots. Calculations:     PP = X / 4     R1 = X / 2 - LOWprev     S1 = X / 2 - HIGHprev Uses: When the pair currency price may change the direction of movement. Possible constraints of support and resistance that creates plateaus for the currency pair prices. Tendency identification by comparing the present prices according to current day's pivot point and also the prior day's pivot points. ____________
FREE
This tool gives you the opportunity to display pivot point support and resistance levels as well as the daily open, weekly close and monthly close levels on your chart with high levels of customization. Pivot points are important horizontal support and resistance levels that get calculated using the high, low and closing price of the previous period (for example D1). With this indicator, you can choose between hourly to monthly timeframes to base your pivot point calculation on. There is a va
FREE
.....................................hi....................... ................for showing high s and low s and support and resistanses .....................we have a lot of ways............................... it can be helpful for finding trends , higher highs , higher lows , lower highs , lower lows .......................today i write on of thems.......................... ........................you can enter the number of last support and resistanses .........................and it will dra
FREE
Bar Size MT4
Mikhail Tcvetkov
5 (3)
The technical indicator, in real time, searches for candlesticks that exceed the size set in the settings and gives signals about them. As a rule, such abnormally large candles appear either at the beginning of strong impulses or at the end of a directional price movement. At the beginning of the pulse, the signal can serve as a basis for searching for an entry point, at the end of the movement, it is a sign of a climax and may indicate the near end of the trend. The reference size for filtering
FREE
The Magic SMA indicator is of great help in determining trend direction. It can be an excellent addition to your existing strategy or the basis of a new one. We humans can make better decisions when we see better visually. So we designed it to show a different color for rising and falling trends. Everyone can customize this in the way that suits them best. By setting the Trend Period, we can optimize it for longer or shorter trends for our strategy. It is great for all time frames. IF YOU NEED
FREE
.................................if you need pivot point s levels............................... ............................this is a daily pivot point level creator........................... ...it is for daily pivots and show levels at times period H4 , H1 , M30 , M15 ,M 5... .................................also shows levels for 3 last days.............................. ................can use it with other indicators and see important levels...............
FREE
This indicator help to mark the high and low of the session Asian,London,Newyork , with custom hour setting This indicator is set to count from minute candle so it will move with the current market and stop at the designated hour and create a accurate line for the day. below is the customization that you can adjust : Input Descriptions EnableAsian Enables or disables the display of Asian session high and low levels. EnableLondon Enables or disables the display of London session high and
FREE
This indicator is one of the useful tools for traders who trade on currency pairs and based on the strength of each currency they can make a correct decision or confirmation in the positions.  It has been calculated for all the minor currency pairs supported by the broker and displays the values of the major currencies. These currencies are displayed horizontally or vertically according to the trader's config when executing the indicator. One of the trading strategies that can be used is to cho
FREE
Follow The Line
Oliver Gideon Amofa Appiah
3.94 (16)
FOLLOW THE LINE GET THE FULL VERSION HERE: https://www.mql5.com/en/market/product/36024 This indicator obeys the popular maxim that: "THE TREND IS YOUR FRIEND" It paints a GREEN line for BUY and also paints a RED line for SELL.  It gives alarms and alerts of all kinds. IT DOES NOT REPAINT and can be used for all currency pairs and timeframes. Yes, as easy and simple as that. Even a newbie can use it to make great and reliable trades. NB: For best results, get my other premium indicators for more
FREE
Not trading time
Mikhail Nazarenko
4 (2)
There are time periods in the market, when trading is highly likely to be unprofitable. This indicator warns you about such non-trading situations and helps you preserve your money and time. Parameters Remind about non-trading periods: Expiration week - remind about the expiration week Consumer index day - remind a day before the release of Consumer index day NON FARM - remind a day before the release of NON FARM Christmas - remind a day before Christmas New Year Days 25.12 - 15.01 - remind abo
FREE
MQLTA Auto Close Demo
MQL4 Trading Automation
Auto Close is an expert advisor that can assist you with your money and risk management rules. The EA can monitor your Balance, Equity, Margin, Global Profit and Global Loss and alert you in case any of these reaches a specified threshold. This Demo Version has Notification and Close features disabled, full version can be found https://www.mql5.com/en/market/product/29141 How does it work? Load the Auto Close EA in the chart and set the parameters you want to keep monitored. If any of the risk
FREE
ScalpingOne for MT4free
Xian Er Sha Ao
3 (1)
Scalping Day Trading Support Utility Scalping One MT4 free One position is displayed with one button. View P & L, Lot, and Point in real time. It is possible to switch the display of positions of only chart currencies and all currency pairs.  (The free version has only 3 positions) Supports automatic identification in Japanese and English   Account currency notation corresponds to dollar, euro, pound, yen (automatic identification) The timeline drawing function can be linked with the clock disp
FREE
Lot Calculator MT4
Ibrahim Olalekan Ganiu
CALCOLA IL TUO LOTTO PROPRIO QUI SU METATRADER!!! Ciao trader. Siete trader orientati alla gestione del rischio? Se sì, allora questo è per voi. Mi chiamo Ibrahim e ho sviluppato uno strumento che può aiutarvi a calcolare il vostro lotto in base alla percentuale di rischio rispetto al saldo del vostro conto. Questo strumento può anche aiutarvi a calcolare il vostro lotto se avete un valore assoluto che desiderate rischiare, invece di specificare il rischio in percentuale. Ad esempio, potete sp
FREE
Profitstat free
Tonny Obare
4 (2)
Profitstat is a free indicator that scans your history and displays it on the chart. The free version shows the number of trades and profit made on the current and previous day. The data is updated instantly as soon as a trade closes. Simply attach it to any chart and it gives the account data irrespective of the chart currency nor timeframe.
FREE
Benvenuti nel nostro   modello di ondata di prezzo   MT4 --(modello ABCD)--     Il modello ABCD è un modello di trading potente e ampiamente utilizzato nel mondo dell'analisi tecnica. È un modello di prezzo armonico che i trader utilizzano per identificare potenziali opportunità di acquisto e vendita sul mercato. Con il modello ABCD, i trader possono anticipare potenziali movimenti di prezzo e prendere decisioni informate su quando entrare e uscire dalle negoziazioni. Versione EA:   Price Wave
FREE
UPD1 D Levels
Vitaliy Kuznetsov
5 (3)
L'indicatore dei livelli si basa sui dati del giorno precedente. La formula matematica determina i livelli di entrata e di uscita.  Raccomandazioni di trading. I livelli vengono negoziati all'inizio della sessione europea, quando appare la volatilità. In caso di volatilità insufficiente, utilizzare metà del take profit per uscire. Se il prezzo si è invertito a metà del take profit, allora sull'inversione cercate un target anche al livello di metà del take profit. Se il prezzo rimbalza dal live
FREE
The Rayol Code Hour Interval Lines indicator was designed to assist your trading experience. It draws the range of hours chosen by the user directly on the chart, so that it enables traders to visualize price movements during their preferred trading hours, providing traders a more comprehensive view of price movements and market dynamics. This indicator allows the user to choose not only the Broker's time, but also the Local time. This way, the user no longer needs to calculate local time in re
FREE
Hogvid Period Separator
David Richard Hinze
5 (1)
Simple and unobtrusive utility for displaying weeks, days and hours Options to control the display of separator lines and labels allow you to customize them to your own taste Display of the separator lines either only in the main chart, or across any indicator windows Automatically reduce intensity of less relevant separator lines and labels for the chart‘s current magnification
FREE
Traditional MACD MT4
Daniel Lewis
4.58 (55)
MACD indicator in MetaTrader 4/5 looks different than MACD does in most other charting software. That is because the MetaTrader 4/5 version of MACD displays the MACD line as a histogram when it is traditionally displayed as a line. Additionally, the MetaTrader 4/5 version computes the Signal line using an SMA, while according to MACD definition it is supposed to be an EMA. The MetaTrader 4/5 version also does not compute a true MACD Histogram (the difference between the MACD/Signal lines). This
FREE
Oscillatore Stocastico RSI avanzato con segnali a doppia linea, sistema a tre livelli, supporto multi-timeframe, segnali visivi personalizzabili e sistema di avvisi altamente configurabile. Servizi di programmazione freelance, aggiornamenti e altri prodotti TrueTL sono disponibili sul mio profilo MQL5 . Feedback e recensioni sono molto apprezzati! Cos'è lo Stocastico RSI? Lo Stocastico RSI (StochRSI) è un indicatore di momentum che applica la formula dell'oscillatore stocastico ai valori RSI
FREE
MT4 AccountInfoEA
Nikolaos Pantzos
Account Info EA It is a tool that presents on the graph all the positions of the account, and specific information concerning the positions, but also the account. It enables the user to have an image of his account at a glance. Use like any expert advisor. You can't attach it in the same chart with other expert advisor. It does not have the ability to open or manage positions. You can attach it on any chart and any timeframe.
FREE
Toby Strategy Indicator
Ahmd Sbhy Mhmd Ahmd ʿYshh
The indicator rely on The Toby strategy >> The mother candle which is bigger in range than the previous six candles. A vertical line shows the last Toby Candle with the targets shown up and down. The strategy is about the closing price out of the range of the toby candle to reach the 3 targets..The most probable to be hit is target1 so ensure reserving your profits and managing your stop lose.
FREE
Gli utenti di questo prodotto hanno anche acquistato
Gann Made Easy
Oleg Rodin
4.83 (157)
Gann Made Easy è un sistema di trading Forex professionale e facile da usare che si basa sui migliori principi del trading utilizzando la teoria di mr. WD Gann. L'indicatore fornisce segnali ACQUISTA e VENDI accurati, inclusi i livelli di Stop Loss e Take Profit. Puoi fare trading anche in movimento utilizzando le notifiche PUSH. CONTATTAMI DOPO L'ACQUISTO PER RICEVERE GRATUITAMENTE LE ISTRUZIONI DI TRADING E OTTIMI INDICATORI EXTRA! Probabilmente hai già sentito parlare molte volte dei metodi d
L'indicatore " Dynamic Scalper System " è progettato per il metodo di scalping, ovvero per il trading all'interno di onde di trend. Testato sulle principali coppie di valute e sull'oro, è compatibile con altri strumenti di trading. Fornisce segnali per l'apertura di posizioni a breve termine lungo il trend, con ulteriore supporto al movimento dei prezzi. Il principio dell'indicatore. Le frecce grandi determinano la direzione del trend. Un algoritmo per generare segnali per lo scalping sotto fo
M1 Sniper
Oleg Rodin
5 (20)
M1 SNIPER è un sistema di indicatori di trading facile da usare. Si tratta di un indicatore a freccia progettato per l'intervallo temporale M1. L'indicatore può essere utilizzato come sistema autonomo per lo scalping sull'intervallo temporale M1 e come parte del tuo sistema di trading esistente. Sebbene questo sistema di trading sia stato progettato specificamente per il trading sull'intervallo temporale M1, può comunque essere utilizzato anche con altri intervalli temporali. Inizialmente ho pro
Atomic Analyst
Issam Kassas
5 (4)
Innanzitutto, vale la pena sottolineare che questo indicatore di trading non è repaint, non è ridisegno e non presenta ritardi, il che lo rende ideale sia per il trading manuale che per quello automatico. Manuale utente: impostazioni, input e strategia. L'Analista Atomico è un indicatore di azione del prezzo PA che utilizza la forza e il momentum del prezzo per trovare un miglior vantaggio sul mercato. Dotato di filtri avanzati che aiutano a rimuovere rumori e segnali falsi, e aumentare il pote
Scalper Inside PRO
Alexey Minkov
4.74 (69)
An exclusive indicator that utilizes an innovative algorithm to swiftly and accurately determine the market trend. The indicator automatically calculates opening, closing, and profit levels, providing detailed trading statistics. With these features, you can choose the most appropriate trading instrument for the current market conditions. Additionally, you can easily integrate your own arrow indicators into Scalper Inside Pro to quickly evaluate their statistics and profitability. Scalper Inside
Trend Lines PRO
Roman Podpora
5 (1)
LINEE DI TENDENZA PRO       Aiuta a capire dove il mercato sta realmente cambiando direzione. L'indicatore mostra reali inversioni di tendenza e punti in cui i principali attori rientrano. Vedi  Linee BOS   Cambiamenti di tendenza e livelli chiave su timeframe più ampi, senza impostazioni complesse o rumore inutile. I segnali non vengono ridisegnati e rimangono sul grafico dopo la chiusura della barra. VERSIONE MT 5     -      Svela il suo massimo potenziale se abbinato all'indicatore   RFI LEVE
Volatility Trend System - un sistema di trading che fornisce segnali per le voci. Il sistema di volatilità fornisce segnali lineari e puntuali nella direzione del trend, nonché segnali per uscirne, senza ridisegnare e ritardi. L'indicatore di tendenza monitora la direzione della tendenza a medio termine, mostra la direzione e il suo cambiamento. L'indicatore di segnale si basa sui cambiamenti della volatilità e mostra gli ingressi nel mercato. L'indicatore è dotato di diversi tipi di avvisi. Pu
Innanzitutto, vale la pena sottolineare che questo Strumento di Trading è un Indicatore Non-Ridipingente, Non-Ridisegnante e Non-Laggante, il che lo rende ideale per il trading professionale. Corso online, manuale utente e demo. L'Indicatore Smart Price Action Concepts è uno strumento molto potente sia per i nuovi che per i trader esperti. Racchiude più di 20 utili indicatori in uno solo, combinando idee di trading avanzate come l'Analisi del Trader del Circolo Interno e le Strategie di Trading
Un indicatore tecnico che struttura i grafici e identifica i movimenti ciclici dei prezzi. Può funzionare su qualsiasi grafico. Diversi tipi di notifiche. Ci sono altre frecce sul grafico stesso. Senza ridisegnare la storia, lavora sulla chiusura della candela. TF consigliati da M5 in su. Parametri facili da usare e configurare. Se si utilizzano 2 indicatori con parametri diversi, è possibile utilizzarli senza altri indicatori. Ha 2 parametri di input Ciclicità e durata del segnale Questi 2 pa
Auto Optimized Parabolic RSI: Motore di Momentum 3D Avanzato La maggior parte degli indicatori per trader privati fallisce perché si affida a parametri statici che smettono di funzionare nel momento in cui la volatilità del mercato cambia. Auto Optimized Parabolic RSI risolve il problema dell'"obsolescenza dell'indicatore" ricalcolando continuamente il proprio vantaggio matematico, portando un adattamento quantitativo di livello istituzionale direttamente sul tuo terminale MT5. Il Vantaggio Prin
RFI levels PRO
Roman Podpora
5 (1)
L'indicatore mostra accuratamente i punti di inversione e le zone di ritorno dei prezzi in cui il       Principali attori   . Vedi dove si formano le nuove tendenze e prendi decisioni con la massima precisione, mantenendo il controllo su ogni operazione. VERSION MT5     -     Rivela il suo massimo potenziale se combinato con l'indicatore   TREND LINES PRO Cosa mostra l'indicatore: Strutture di inversione e livelli di inversione con attivazione all'inizio di un nuovo trend. Visualizzazione dei l
Trend indicator AI
Ramil Minniakhmetov
4.49 (84)
Trend Ai indicator è un ottimo strumento che migliorerà l'analisi di mercato di un trader combinando l'identificazione della tendenza con punti di ingresso utilizzabili e avvisi di inversione. Questo indicatore consente agli utenti di navigare nelle complessità del mercato forex con fiducia e precisione Oltre ai segnali primari, l'indicatore Ai di tendenza identifica i punti di ingresso secondari che si presentano durante i pullback o i ritracciamenti, consentendo ai trader di capitalizzare le
Se acquisti questo indicatore, riceverai il mio Trade Manager Professionale   + EA  GRATUITAMENTE. Innanzitutto è importante sottolineare che questo sistema di trading è un indicatore Non-Repainting, Non-Redrawing e Non-Lagging, il che lo rende ideale sia per il trading manuale che per quello automatico. Corso online, manuale e download di preset. Il "Sistema di Trading Smart Trend MT5" è una soluzione completa pensata sia per i trader principianti che per quelli esperti. Combina oltre 10 indic
MTF Supply Demand Zones
Georgios Kalomoiropoulos
4.82 (22)
Nuova generazione di zone di domanda e offerta automatizzate. Algoritmo nuovo e innovativo che funziona su qualsiasi grafico. Tutte le zone vengono create dinamicamente in base all'azione dei prezzi del mercato. DUE TIPI DI AVVISI --> 1) QUANDO IL PREZZO RAGGIUNGE UNA ZONA 2) QUANDO SI FORMA UNA NUOVA ZONA Non ottieni un altro indicatore inutile. Ottieni una strategia di trading completa con risultati comprovati.     Nuove caratteristiche:     Avvisi quando il prezzo raggiunge la zona di
Currency Strength Exotics
Bernhard Schweigert
4.88 (33)
ATTUALMENTE SCONTATO DEL 20%! La soluzione migliore per qualsiasi principiante o trader esperto! Questo indicatore è specializzato nel mostrare la forza della valuta per qualsiasi simbolo come coppie esotiche, materie prime, indici o futures. È il primo nel suo genere, qualsiasi simbolo può essere aggiunto alla nona riga per mostrare la vera forza della valuta di Oro, Argento, Petrolio, DAX, US30, MXN, TRY, CNH ecc. Si tratta di uno strumento di trading unico, di alta qualità e conveniente pe
The Super Arrow Indicator provides non-repainting buy and sell signals with exceptional accuracy. Key Features No repainting – confirmed signals remain fixed Clear visual arrows: green for buy, red for sell Real-time alerts via pop-up, sound, and optional email Clean chart view with no unnecessary clutter Works on all markets: Forex, gold, oil, indices, crypto Adjustable Parameters TimeFrame Default: "current time frame" Function: Sets the time frame for indicator calculation Options: Can be set
Currency Strength Wizard è un indicatore molto potente che ti fornisce una soluzione all-in-one per un trading di successo. L'indicatore calcola la potenza di questa o quella coppia forex utilizzando i dati di tutte le valute su più intervalli di tempo. Questi dati sono rappresentati in una forma di indice di valuta facile da usare e linee elettriche di valuta che puoi utilizzare per vedere il potere di questa o quella valuta. Tutto ciò di cui hai bisogno è collegare l'indicatore al grafico che
Dynamic Forex28 Navigator
Bernhard Schweigert
4.43 (7)
Dynamic Forex28 Navigator - Lo strumento di trading Forex di nuova generazione. ATTUALMENTE SCONTATO DEL 49%. Dynamic Forex28 Navigator è l'evoluzione dei nostri indicatori popolari di lunga data, che combinano la potenza di tre in uno: Advanced Currency Strength28 Indicator (695 recensioni) + Advanced Currency IMPULSE con ALERT (520 recensioni) + CS28 Combo Signals (Bonus). Dettagli sull'indicatore https://www.mql5.com/en/blogs/post/758844 Cosa offre l'indicatore di forza di nuova generazione?
Advanced Supply Demand
Bernhard Schweigert
4.91 (299)
Speciale Trading- SCONTO DEL 40% La soluzione migliore per qualsiasi trader principiante o esperto! Questo indicatore è uno strumento di trading unico, di alta qualità e conveniente, perché abbiamo incorporato una serie di funzionalità proprietarie e una nuova formula. Con questo aggiornamento, potrai visualizzare doppie zone di timeframe. Non solo potrai visualizzare un TF più alto, ma anche entrambi, il TF del grafico e il TF più alto: MOSTRA ZONE ANNIDATE. Tutti i trader che operano con Of
Adaptive Volatility Range [AVR] is a powerful tool for identifying key trend reversal points. AVR accurately reflects the Average True Range (ATR) of volatility, taking into account the Volume-Weighted Average Price (VWAP). The indicator adapts to any market volatility by calculating the average volatility over a specific period, ensuring a stable rate of profitable trades. You receive not just an indicator but a professional automated trading system , AVR-EA . Advantages: Automated Trading Sys
TPSpro RFI Levels
Roman Podpora
4.86 (28)
ISTRUZIONI RUS  /  ISTRUZIONI   ENG  /  Versione MT5 Funzioni principali: Visualizza le zone attive di venditori e acquirenti! L'indicatore mostra tutti i livelli/zone di primo impulso corretti per acquisti e vendite. Quando questi livelli/zone vengono attivati, ovvero dove inizia la ricerca dei punti di ingresso, i livelli cambiano colore e vengono riempiti con colori specifici. Vengono visualizzate anche delle frecce per una percezione più intuitiva della situazione. LOGIC AI - Visualizzazion
Il profitto dalla struttura del mercato cambia quando il prezzo si inverte e si ritira. L'indicatore di avviso di inversione della struttura del mercato identifica quando una tendenza o un movimento di prezzo si sta avvicinando all'esaurimento e pronto a invertire. Ti avvisa dei cambiamenti nella struttura del mercato che in genere si verificano quando stanno per verificarsi un'inversione o un forte pullback. L'indicatore identifica inizialmente i breakout e lo slancio del prezzo, ogni volta c
BTMM State Engine Pro is a MetaTrader 4 indicator for traders who use the Beat The Market Maker approach: Asian session context, kill zone timing, level progression, peak formation detection, and a multi-pair scanner from a single chart. It combines cycle state logic with a built-in scanner dashboard so you do not need the same tool on many charts at once. What it does Draws the Asian session range; session times can follow broker server offset or be set in inputs. Tracks level progression (L
TrendLine PRO MT4
Evgenii Aksenov
4.83 (167)
The Trend Line PRO indicator is an independent trading strategy. It shows the trend change, the entry point to the transaction, as well as automatically calculates three levels of Take Profit and Stop Loss protection. Trend Line PRO is perfect for all Meta Trader symbols: currencies, metals, cryptocurrencies, stocks and indices. The indicator is used in trading on real accounts, which confirms the reliability of the strategy. Robots using   Trend Line PRO   and real Signals can be found here:   
Looking for a powerful yet lightweight swing detector that accurately identifies market structure turning points? Want clear, reliable buy and sell signals that work across any timeframe and any instrument? Buy Sell Arrow MT Swing is built exactly for that — precision swing detection made simple and effective. This indicator identifies Higher Highs (HH) , Higher Lows (HL) , Lower Highs (LH) , and Lower Lows (LL) with remarkable clarity. It is designed to help traders easily visualize market stru
CyberZingFx Volume Plus
Afsal Meerankutty
4.94 (17)
Advanced version of CyberZingFx Volume Plus, the ultimate MT4 indicator for traders seeking highly accurate buy and sell signals. With an additional strategy and price action dot signals that enhances its effectiveness, this indicator offers a superior trading experience for professionals and beginners alike. The CyberZingFx Volume Plus Advanced version combines the power of volume analysis and historical price data with an additional strategy, resulting in even more precise and reliable signals
Matrix Arrow Indicator MT4
Juvenille Emperor Limited
5 (3)
Matrix Arrow Indicator MT4 è un trend unico 10 in 1 che segue un indicatore multi-timeframe al 100% non ridipinto che può essere utilizzato su tutti i simboli/strumenti: forex, materie prime, criptovalute, indici, azioni.  Matrix Arrow Indicator MT4 determinerà la tendenza attuale nelle sue fasi iniziali, raccogliendo informazioni e dati da un massimo di 10 indicatori standard, che sono: Indice di movimento direzionale medio (ADX) Indice del canale delle materie prime (CCI) Candele classiche He
Support Resistance screnner
STE S.S.COMPANY
4.95 (37)
Support And Resistance Screener è in un indicatore di livello per MetaTrader che fornisce più strumenti all'interno di un indicatore. Gli strumenti disponibili sono: 1. Screener della struttura del mercato. 2. Zona di ritiro rialzista. 3. Zona di ritiro ribassista. 4. Punti pivot giornalieri 5. Punti pivot settimanali 6. Punti pivot mensili 7. Forte supporto e resistenza basati sul modello e sul volume armonici. 8. Zone a livello di banca. OFFERTA A TEMPO LIMITATO: il supporto HV e l'indicatore
Scalping Entry Points - è un sistema di trading manuale che può adattarsi ai movimenti dei prezzi e dare segnali per aprire le negoziazioni senza ridisegnare. L'indicatore determina la direzione del trend dal livello centrale di supporto e resistenza. L'indicatore a punto fornisce segnali per entrate e uscite. Adatto per trading intraday manuale, scalping e opzioni binarie. Funziona su tutti i tempi e strumenti di trading. L'indicatore fornisce diversi tipi di avvisi. Come utilizzare il prodott
Attualmente 40% di sconto! La soluzione migliore per ogni principiante o trader esperto! Questo software per cruscotti funziona su 28 coppie di valute. Si basa su 2 dei nostri indicatori principali (Advanced Currency Strength 28 e Advanced Currency Impulse). Offre un'ottima panoramica dell'intero mercato Forex. Mostra i valori di forza delle valute avanzate, la velocità di movimento delle valute e i segnali per 28 coppie Forex in tutti i (9) timeframe. Immaginate come migliorerà il vostro tra
Altri dall’autore
Sei pronto a diventare lo Sherlock Holmes del trading forex? ️‍️ Presentiamo l'ultimo strumento per il trading: l'indicatore Lisek Levels and Channels !!! Dimentica di fare il giocoliere con più indicatori come in un numero da circo. Abbiamo racchiuso tutto ciò di cui hai bisogno in uno spettacolo impressionante: Livelli di prezzo? Fatto! Canali di prezzo? Ci puoi scommettere! VWAP del prezzo? Oh sì! Volume On Balance? C'è tutto! E la ciliegina sulla torta? Allarmi e notifiche push
FREE
Lisek Levels EA
Darius Hans Lischka
4.4 (5)
Simple but powerfull Trend and Hedge EA for Lisek Levels and Channels Indicator . 1. Download Lisek Levels and Channels Indicator . 2. Backtest and optimize in Strategy Tester. 3. For Agressive Tick Mode set your Chart to M1 Time Frame. 4. To speed up Strategy Tester, set "Show Info" to   false   ! 5. After backtesting, it’s important to analyse the test results  (best profit and smallest drawdown). 6. Test your EA settings on Demo Account. Happy Trading !!!
FREE
Lisek Weis Wave
Darius Hans Lischka
5 (3)
This Weis Wave Volume indicator is a tool to help traders identify the current price trend.  Understanding volume can provide insight into a market's behavior to help you determine its overall health. The most important rule is this: volume precedes price. Typically, before a market price moves, volume comes into play. It has 2 main colors histogram which are green and red. – Green indicates an upward wave. The more the price increases, the bigger the green volume gets. – The red color shows a d
FREE
Lisek ATR Levels
Darius Hans Lischka
5 (3)
Are you looking for  ATR Levels,   ATR Trend, ATR Support and Resistance  Indicators ? Now you have all in one !!!  Info on your chart is showing you: where current price and levels are, what is current trend and signals. Search for an entry with low risk for trading by Lisek ATR Indicator. There are many ways to trade with Lisek ATR Indicator: Trade Support and Resistance Levels. Trade pullbacks (Range trading). Trade breakouts. Trade reversals. Take profit or set stop-loss based on ATR Levels.
FREE
Simple ATR StopLoss
Darius Hans Lischka
Simple ATR Stop Loss : La tua bussola della volatilità del mercato che ti aiuta a navigare nelle acque insidiose del trading , impostando Stop Loss più intelligenti e facendoti sembrare un ninja del trading (mantello non incluso). Attenzione, appassionati di trading ed esperti di mercato! Ecco l'indicatore Simple ATR Stop Loss – il tuo nuovo migliore amico nel selvaggio mondo del trading. È più semplice di un puzzle da due pezzi ma più potente di un toro caffeinsato in un negozi
FREE
Lisek Waves
Darius Hans Lischka
4 (1)
Search for an entry with low risk for trading by Lisek Waves Indicator. Using Lisek Waves Indicator can improve your trading performance. In it’s simplest form, this trading tool make it easy to s earch for an entry with low risk   and to manage your trade and risk. Lisek Wave analysis is based on the notion that markets follow specific patterns called waves which are the result of a natural rhythm of crowd psychology that exists in all markets. You can avoid the loss from taking trades that are
FREE
Lisek Multi MA
Darius Hans Lischka
5 (1)
Search for an entry with low risk for trading by Lisek Moving Average Indicator. There are many ways to trade with Lisek Moving Average Indicator: Trend continuation (Trend trading). Trade pullbacks (Range trading). Trade breakouts. Trade reversals. Take profits or set stop-loss based on your MA. Moving Averages are a frequently used technical indicator in forex trading, especially over 10, 50, 100, and 200 periods. Moving Averages are lagging indicators, which means they don't predict where p
FREE
Lisek Stochastic
Darius Hans Lischka
2.83 (6)
Lisek Stochastic   oscillator indicator with Alarm, Push Notifications and e-mail  Notifications. The Stochastic indicator is a momentum indicator that shows you how strong or weak the current trend is. It helps you identify overbought and oversold market conditions within a trend. The Stochastic indicator is lagging indicator, which means it don't predict where price is going, it is only providing data on where price has been !!! How to trade with Stochastic indicator: Trend following: As long
FREE
Filtro:
Nessuna recensione
Rispondi alla recensione