ATR Pyramid

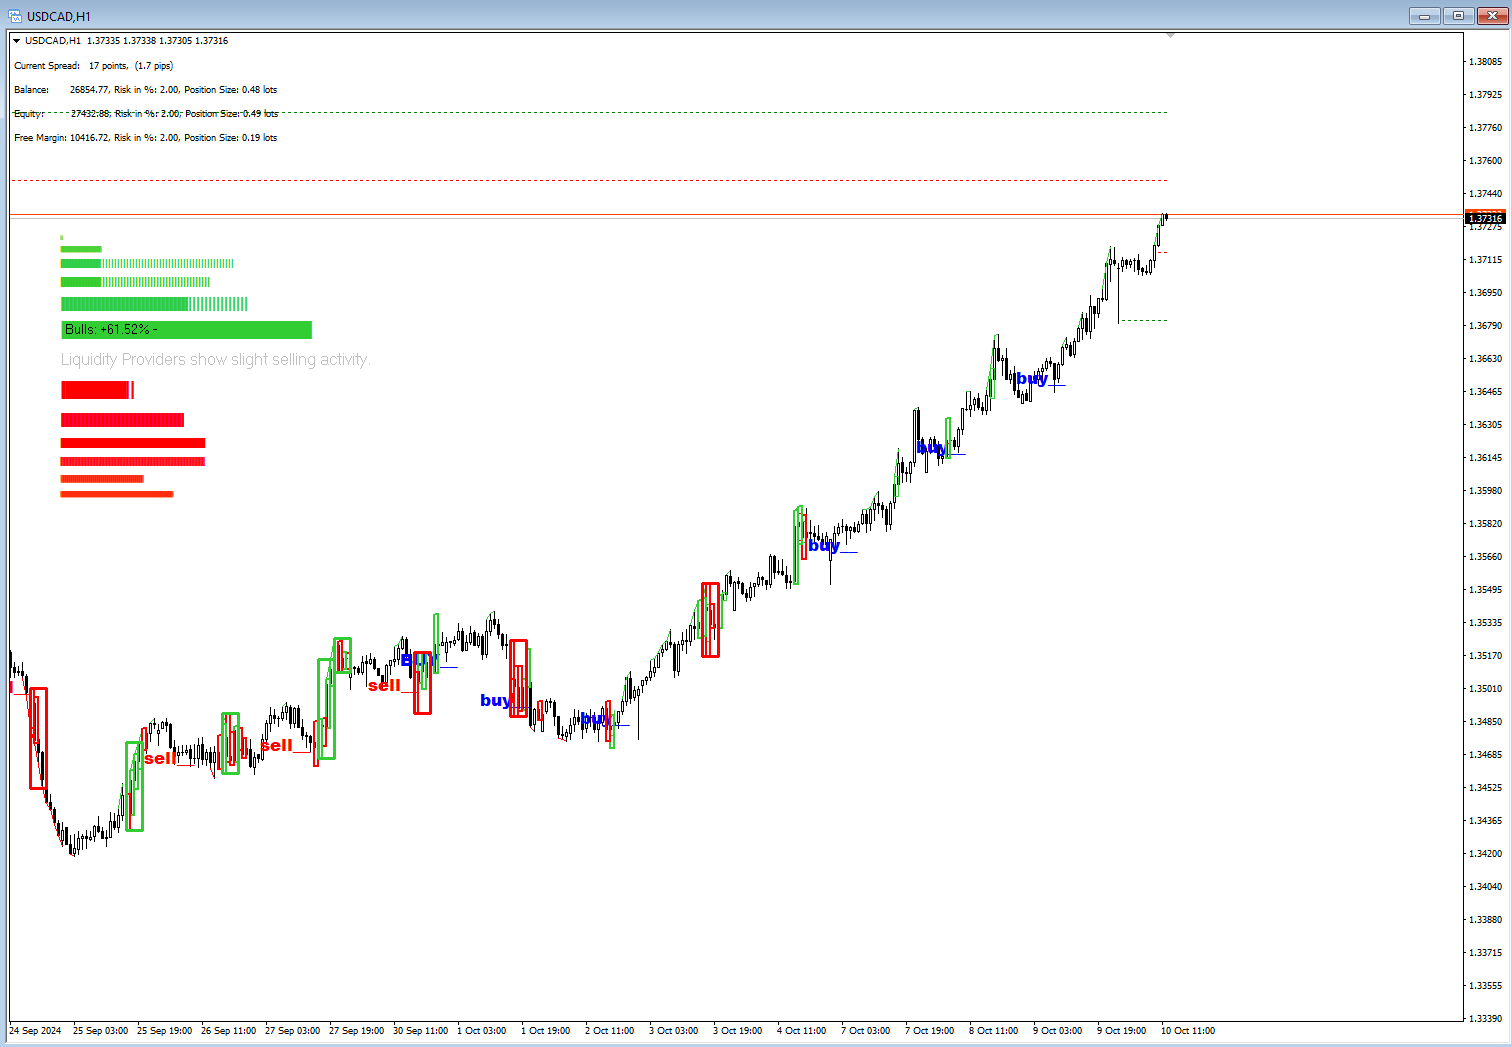
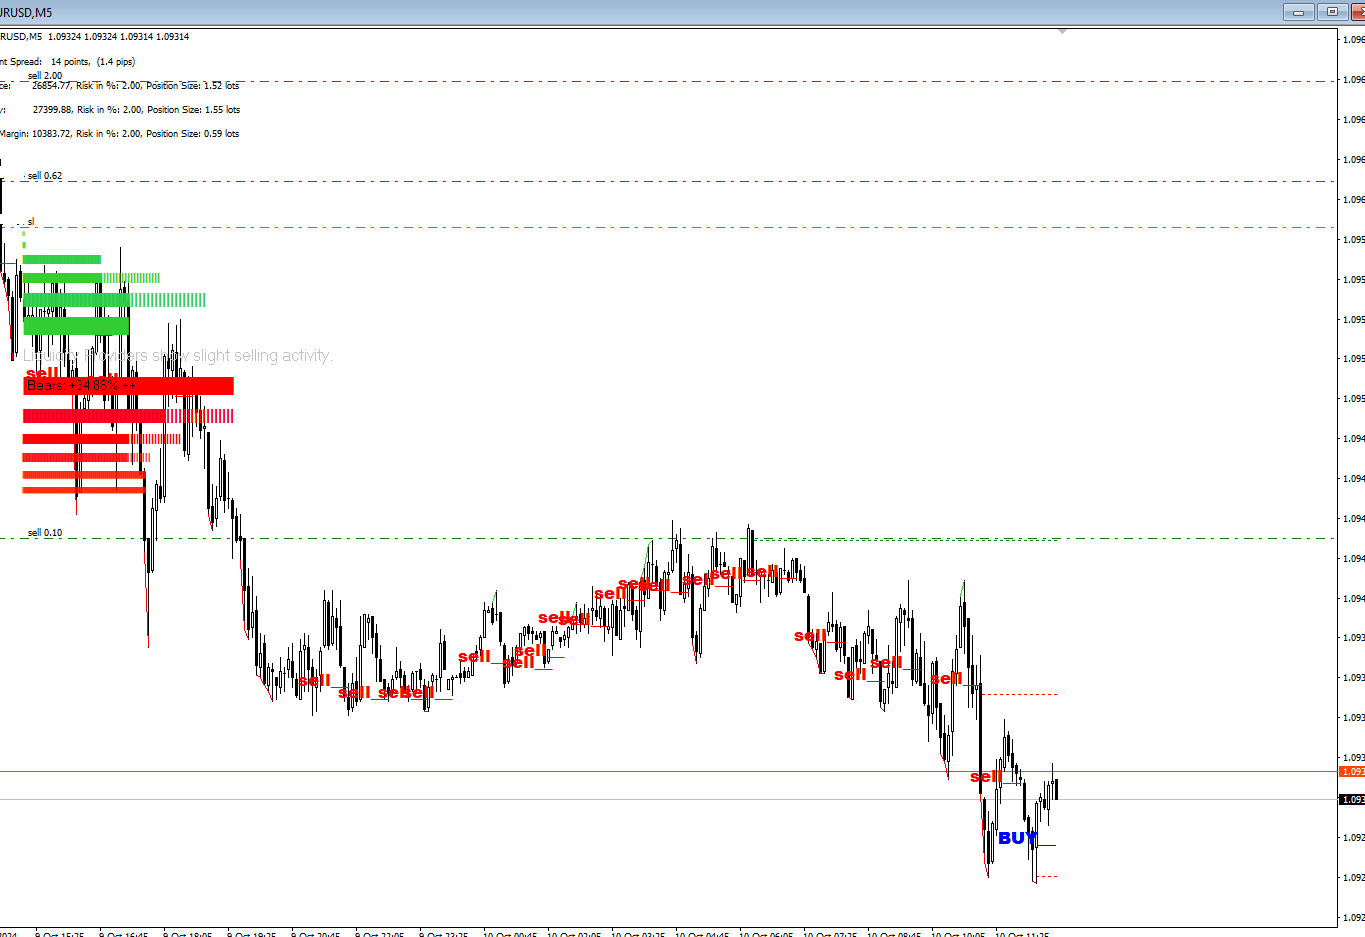
ATR Pyramid 🏔️: Your ticket to stacking profits higher than a Jenga tower on steroids 🗼💪, turning market volatility into a trend-surfing 🏄‍♂️, position-adding party 🎉 where only the first trade risks a wipeout 🌊, while you safeguard the rest by sliding your stop loss up like an elevator 🛗, creating a comfort zone that's the only real path to multiplying your forex account faster than a rabbit on espresso !!! ☕🐰💨

Attention all you profit-stackers and trend-surfers! 📢🏄‍♂️ This ATR Pyramid indicator is for those of you who like to build financial pyramids (the legal kind, we promise 😉).

You know how they say ATR only shows market volatility? 📊 Well, plot twist – it's not the whole story! 🎭 This crafty little tool can actually sniff out trend direction faster than a bloodhound on a coffee binge. 🐕☕ And guess what? We're using it to pile on those profits like it's an all-you-can-eat buffet. 🍽️💰

But wait, there's more! 🎩✨ To build a pyramid as magnificent as the one in Giza, or even taller, we recommend checking what the biggest Market Makers are up to. How? With the Glimpz indicator from glimpz.net! 🕵️‍♂️🌐 It's like having a secret window into the minds of the market giants. Don't trade against the tide, ride the wave with the big fish! 🐳🏄‍♂️

Picture this: You're not just riding the trend, you're building a skyscraper on it. 🏗️ Each floor? A new position added to your winning streak. 📈 It's like playing Jenga in reverse – the higher you go, the more stable it gets! 🧱🔄

Remember, folks: Pyramiding profits is the only way to grow your capital while keeping losses on a strict diet. 💪💰 If you're playing your cards right, only your first position is flirting with the risk of loss. 🃏 It's like having a sacrificial pawn in a chess game, except this pawn might just turn into a queen. ♟️👑

So, lead your pyramids wisely, traders. Don't build them higher than the Tower of Pisa, and definitely don't let them lean that much. 🗼⚖️ And with Glimpz by your side, you'll be building your trading empire on solid ground! 🏛️💼

Happy pyramiding, you crazy profit architects! 🏗️🤪 May your trends be ever in your favor, and may your profits stack higher than a sandwich in a New York deli !!! 🥪🗽💰


추천 제품
MQLTA Support Resistance Lines is an indicator that calculates the historical levels of Support and Resistance and display them as Lines on chart. It will also Alert you if the price is in a Safe or Dangerous zone to trade and show you the distance to the next level. The indicator is ideal to be used in other Expert Advisor through the iCustom function. This DEMO only works with AUDNZD, the full product can be found at https://www.mql5.com/en/market/product/26328 How does it work? The indicator
FREE
MQLTA Support Resistance Lines
MQL4 Trading Automation
4.33 (12)
MQLTA Support Resistance Lines is an indicator that calculates the historical levels of Support and Resistance and display them as Lines on chart. It will also Alert you if the price is in a Safe or Dangerous zone to trade and show you the distance to the next level. The indicator is ideal to be used in other Expert Advisor through the iCustom function. This indicator can be tested LIVE on AUDNZD with the following DEMO https://www.mql5.com/en/market/product/26572 How does it work? The indicato
FREE
The selective pin bar is designed to identify reversals. To use the selective pin bar effectively, traders typically look for Strong Rejection: The tail of the pin bar should extend significantly beyond the surrounding price action. It indicates that there was a sharp rejection of higher or lower prices during the trading period. A strong rejection suggests that the market sentiment may be changing.
FREE
Show Pips
Roman Podpora
4.26 (58)
이 정보 표시기는 계정의 현재 상황을 항상 알고 싶어하는 사람들에게 유용합니다. 표시기는 포인트, 백분율, 통화 단위의 이익뿐만 아니라 현재 쌍의 스프레드와 현재 기간에서 막대가 마감될 때까지의 시간과 같은 데이터를 표시합니다. 버전 MT5 -   더욱 유용한 지표 차트에 정보선을 배치하는 데는 여러 가지 옵션이 있습니다. 가격 오른쪽(가격보다 뒤에 있음) 코멘트로(차트의 왼쪽 상단에 있음) 화면의 선택된 모서리에 있습니다. 정보 구분 기호를 선택할 수도 있습니다. | / . \ # 표시기에는 다음과 같은 단축키가 내장되어 있습니다. 키 1 - 정보 표시 유형으로 뒤로 이동(가격, 설명 또는 코너 오른쪽) 키 2 - 정보 표시 유형에서 앞으로 나아갑니다. 키 3 - 정보 라인 표시 위치 변경 단축키는 설정에서 다시 할당할 수 있습니다. 이 표시기는 사용하기 쉽고 매우 유익합니다. 설정에서 불필요한 정보 항목을 비활성화할 수 있습니다. 설정 표시된 정보를 교체하기 위한 단축키(뒤로
FREE
Silver Bullet MT4
Saksham Solanki
5 (2)
Contact me for any queries or custom orders, if you want to use this in an EA. Key Features: Pattern Recognition : Identifies Fair Value Gaps (FVGs) Spots Break of Structure (BOS) points Detects Change of Character (CHoCH) patterns Versatile Application : Optimized for candlestick charts Compatible with any chart type and financial instrument Real-Time and Historical Analysis : Works seamlessly with both real-time and historical data Allows for backtesting strategies and live market analysis Vi
FREE
SmartTrade Manager
Aleksandr Andreev
The indicator is a multifunctional tool for automating the analysis and visualization of the trading process. Main features: News display — the indicator automatically loads and displays economic news on the chart, allowing you to take into account important events when trading. Dynamic timeframe change — during the news release, the chart switches to a preset period for more detailed analysis. Adapting to the number of orders — the timeframe can change automatically depending on the number of
FREE
This indicator is stand alone version from  MP Pivot Levels  (All in one) containing Woodie Pivots. Woodie’s pivot points are made up of multiple key levels, calculated from past price points, in order to frame trades in a simplistic manner. The key levels include the ‘pivot’ itself, and multiple support and resistance levels (usually up to three each). Traders use these levels as a guide for future price movements when setting up trades. The pivot : (Previous high + previous low + 2 x previous
FREE
MP Demark Pivot Levels
Pierre Ksachikian
4 (1)
This indicator is stand alone version from  MP Pivot Levels  (All in one) containing Demark's Pivots. Calculations:     PP = X / 4     R1 = X / 2 - LOWprev     S1 = X / 2 - HIGHprev Uses: When the pair currency price may change the direction of movement. Possible constraints of support and resistance that creates plateaus for the currency pair prices. Tendency identification by comparing the present prices according to current day's pivot point and also the prior day's pivot points. ____________
FREE
Professional Pivot Points
Simon Busley
3.88 (8)
This tool gives you the opportunity to display pivot point support and resistance levels as well as the daily open, weekly close and monthly close levels on your chart with high levels of customization. Pivot points are important horizontal support and resistance levels that get calculated using the high, low and closing price of the previous period (for example D1). With this indicator, you can choose between hourly to monthly timeframes to base your pivot point calculation on. There is a va
FREE
Support resistanses show
Meysam Ghasemi
1 (1)
.....................................hi....................... ................for showing high s and low s and support and resistanses .....................we have a lot of ways............................... it can be helpful for finding trends , higher highs , higher lows , lower highs , lower lows .......................today i write on of thems.......................... ........................you can enter the number of last support and resistanses .........................and it will dra
FREE
Bar Size MT4
Mikhail Tcvetkov
5 (3)
The technical indicator, in real time, searches for candlesticks that exceed the size set in the settings and gives signals about them. As a rule, such abnormally large candles appear either at the beginning of strong impulses or at the end of a directional price movement. At the beginning of the pulse, the signal can serve as a basis for searching for an entry point, at the end of the movement, it is a sign of a climax and may indicate the near end of the trend. The reference size for filtering
FREE
The Magic SMA indicator is of great help in determining trend direction. It can be an excellent addition to your existing strategy or the basis of a new one. We humans can make better decisions when we see better visually. So we designed it to show a different color for rising and falling trends. Everyone can customize this in the way that suits them best. By setting the Trend Period, we can optimize it for longer or shorter trends for our strategy. It is great for all time frames. IF YOU NEED
FREE
.................................if you need pivot point s levels............................... ............................this is a daily pivot point level creator........................... ...it is for daily pivots and show levels at times period H4 , H1 , M30 , M15 ,M 5... .................................also shows levels for 3 last days.............................. ................can use it with other indicators and see important levels...............
FREE
Session High Low
Jerome Asiusin
This indicator help to mark the high and low of the session Asian,London,Newyork , with custom hour setting This indicator is set to count from minute candle so it will move with the current market and stop at the designated hour and create a accurate line for the day. below is the customization that you can adjust : Input Descriptions EnableAsian Enables or disables the display of Asian session high and low levels. EnableLondon Enables or disables the display of London session high and
FREE
This indicator is one of the useful tools for traders who trade on currency pairs and based on the strength of each currency they can make a correct decision or confirmation in the positions.  It has been calculated for all the minor currency pairs supported by the broker and displays the values of the major currencies. These currencies are displayed horizontally or vertically according to the trader's config when executing the indicator. One of the trading strategies that can be used is to cho
FREE
Follow The Line
Oliver Gideon Amofa Appiah
3.94 (16)
FOLLOW THE LINE GET THE FULL VERSION HERE: https://www.mql5.com/en/market/product/36024 This indicator obeys the popular maxim that: "THE TREND IS YOUR FRIEND" It paints a GREEN line for BUY and also paints a RED line for SELL.  It gives alarms and alerts of all kinds. IT DOES NOT REPAINT and can be used for all currency pairs and timeframes. Yes, as easy and simple as that. Even a newbie can use it to make great and reliable trades. NB: For best results, get my other premium indicators for more
FREE
Not trading time
Mikhail Nazarenko
4 (2)
There are time periods in the market, when trading is highly likely to be unprofitable. This indicator warns you about such non-trading situations and helps you preserve your money and time. Parameters Remind about non-trading periods: Expiration week - remind about the expiration week Consumer index day - remind a day before the release of Consumer index day NON FARM - remind a day before the release of NON FARM Christmas - remind a day before Christmas New Year Days 25.12 - 15.01 - remind abo
FREE
MQLTA Auto Close Demo
MQL4 Trading Automation
Auto Close is an expert advisor that can assist you with your money and risk management rules. The EA can monitor your Balance, Equity, Margin, Global Profit and Global Loss and alert you in case any of these reaches a specified threshold. This Demo Version has Notification and Close features disabled, full version can be found https://www.mql5.com/en/market/product/29141 How does it work? Load the Auto Close EA in the chart and set the parameters you want to keep monitored. If any of the risk
FREE
Scalping Day Trading Support Utility Scalping One MT4 free One position is displayed with one button. View P & L, Lot, and Point in real time. It is possible to switch the display of positions of only chart currencies and all currency pairs.  (The free version has only 3 positions) Supports automatic identification in Japanese and English   Account currency notation corresponds to dollar, euro, pound, yen (automatic identification) The timeline drawing function can be linked with the clock disp
FREE
Lot Calculator MT4
Ibrahim Olalekan Ganiu
메타트레이더에서 바로 랏사이즈를 계산하세요!!! 안녕하세요, 트레이더 여러분. 위험 관리에 중점을 두시는 트레이더이신가요? 그렇다면 바로 이 기능이 도움이 될 것입니다. 저는 이브라힘입니다. 계좌 잔액 대비 위험 비율을 기반으로 랏사이즈를 계산하는 도구를 개발했습니다. 위험 비율을 %로 지정하는 대신 절대값을 지정하여 랏사이즈를 계산할 수도 있습니다. 예를 들어, 잔액에서 $100를 위험에 빠뜨리고 싶다고 지정할 수 있습니다. MT5 버전: https://www.mql5.com/en/market/product/155025 무료입니다. 꼭 확인해 보세요. 댓글로 추가했으면 하는 기능이나 커뮤니티를 위해 개발했으면 하는 다음 도구를 알려주세요. 즐거운 트레이딩, 즐거운 자동화 되세요!!!
FREE
Profitstat is a free indicator that scans your history and displays it on the chart. The free version shows the number of trades and profit made on the current and previous day. The data is updated instantly as soon as a trade closes. Simply attach it to any chart and it gives the account data irrespective of the chart currency nor timeframe.
FREE
WH Price Wave Pattern MT4
Wissam Hussein
4.4 (5)
Welcome to our   Price Wave Pattern   MT4 --(ABCD Pattern)-- The ABCD pattern is a powerful and widely used trading pattern in the world of technical analysis. It is a harmonic price pattern that traders use to identify potential buy and sell opportunities in the market. With the ABCD pattern, traders can anticipate potential price movements and make informed decisions on when to enter and exit trades. EA Version : Price Wave EA MT4 MT5 version : Price Wave Pattern MT5 Features :  Automatic
FREE
UPD1 D Levels
Vitaliy Kuznetsov
5 (3)
레벨 인디케이터는 전일 데이터를 기준으로 합니다. 수학 공식에 따라 진입 및 청산 레벨이 결정됩니다.  트레이딩 추천. 레벨은 변동성이 나타날 때 유럽 세션이 시작될 때 거래됩니다. 변동성이 충분하지 않은 경우 테이크프로핏의 절반을 사용하여 종료합니다. 가격이 절반 테이크프로핏에서 반전했다면 반전 시 목표가도 절반 테이크프로핏 수준에서 설정합니다. 가격이 진입 가격에서 반등했다면 반대 방향으로 가격이 두 번째 테이크프로핏에 도달할 수 있습니다. 항상 브레이크 아웃에 진입해서는 안됩니다. 재테스트(레벨 돌파 후 반대쪽에서 테스트)를 기다리는 것이 좋습니다. 재테스트는 시장에 최소 거래량 레벨이 여러 개 있는 경우 잘 작동합니다. UPD1 프로필 레벨 표시기를 참조하세요. 입력 매개변수. Start Hour - 몇 시부터 하루의 시작을 계산합니다. 00 - 기본값. Visual Button - 버튼 표시(활성화/비활성화). Corner - 버튼 앵커 각도. X indent -
FREE
The Rayol Code Hour Interval Lines indicator was designed to assist your trading experience. It draws the range of hours chosen by the user directly on the chart, so that it enables traders to visualize price movements during their preferred trading hours, providing traders a more comprehensive view of price movements and market dynamics. This indicator allows the user to choose not only the Broker's time, but also the Local time. This way, the user no longer needs to calculate local time in re
FREE
Hogvid Period Separator
David Richard Hinze
5 (1)
Simple and unobtrusive utility for displaying weeks, days and hours Options to control the display of separator lines and labels allow you to customize them to your own taste Display of the separator lines either only in the main chart, or across any indicator windows Automatically reduce intensity of less relevant separator lines and labels for the chart‘s current magnification
FREE
Traditional MACD MT4
Daniel Lewis
4.58 (55)
MACD indicator in MetaTrader 4/5 looks different than MACD does in most other charting software. That is because the MetaTrader 4/5 version of MACD displays the MACD line as a histogram when it is traditionally displayed as a line. Additionally, the MetaTrader 4/5 version computes the Signal line using an SMA, while according to MACD definition it is supposed to be an EMA. The MetaTrader 4/5 version also does not compute a true MACD Histogram (the difference between the MACD/Signal lines). This
FREE
이중 라인 신호, 세 레벨 시스템, 멀티 타임프레임 지원, 사용자 정의 시각 신호 및 고도로 구성 가능한 알림 시스템을 갖춘 고급 스토캐스틱 RSI 오실레이터. 프리랜서 프로그래밍 서비스, 업데이트 및 기타 TrueTL 제품은 제 MQL5 프로필 에서 이용하실 수 있습니다. 피드백과 리뷰를 환영합니다! 스토캐스틱 RSI란 무엇인가요? 스토캐스틱 RSI(StochRSI)는 가격 데이터 대신 RSI 값에 스토캐스틱 오실레이터 공식을 적용한 모멘텀 지표입니다. 지정된 기간 동안 고가-저가 범위 대비 RSI 수준을 측정하여 0과 100 사이에서 진동하는 더욱 민감한 지표를 만들어냅니다. StochRSI는 두 개의 라인으로 구성됩니다: %K(메인 라인)와 %D(시그널 라인, %K의 이동 평균). 이 지표는 RSI 자체 내의 과매수 및 과매도 상태를 식별하는 데 특히 유용하며, 전통적인 RSI나 스토캐스틱 지표보다 빠른 신호를 제공합니다. %K와 %D 라인 간의 교차와 레벨 경계를 통한
FREE
Account Info EA It is a tool that presents on the graph all the positions of the account, and specific information concerning the positions, but also the account. It enables the user to have an image of his account at a glance. Use like any expert advisor. You can't attach it in the same chart with other expert advisor. It does not have the ability to open or manage positions. You can attach it on any chart and any timeframe.
FREE
Toby Strategy Indicator
Ahmd Sbhy Mhmd Ahmd ʿYshh
The indicator rely on The Toby strategy >> The mother candle which is bigger in range than the previous six candles. A vertical line shows the last Toby Candle with the targets shown up and down. The strategy is about the closing price out of the range of the toby candle to reach the 3 targets..The most probable to be hit is target1 so ensure reserving your profits and managing your stop lose.
FREE
Trendline indicator
David Muriithi
2 (1)
Are you tired of drawing trendlines every time you're analyzing charts? Or perhaps you would like more consistency in your technical analysis. Then this is for you. This indicator will draw trend lines automatically when dropped on a chart. How it works Works similar to standard deviation channel found on mt4 and mt5. It has 2 parameters: 1. Starting Bar 2. Number of bars for calculation The   starting bar   is the bar which drawing of the trend lines will begin, while the   number of bars for c
FREE
이 제품의 구매자들이 또한 구매함
Neuro Poseidon MT4
Daria Rezueva
4.95 (19)
Neuro Poseidon is a new indicator by Daria Rezueva. It combines precise trading signals with adaptive TP/SL levels - creating best possible trades as a result! Message me and get  Neuro Poseidon Assistant  as a gift to automize your trading process! What makes it stand out? 1. Proven profitability on all assets and timeframes 2. Only confirmed BUY and SELL signals present on the chart 3. Adaptive TP & SL levels generated by the software for each trade 4. Easy to understand - suitable for all
Scalper Inside PRO
Alexey Minkov
4.74 (68)
Scalper Inside PRO Scalper Inside PRO is an intraday trend and scalping indicator for MetaTrader 4 that uses an exclusive algorithm to quickly detect market direction and key target levels. It automatically calculates entry, exit and multiple profit targets, and shows detailed performance statistics so you can see how different instruments and strategies performed. This helps you choose the most suitable trading instruments for the current market conditions. Additionally, you can easily integrat
M1 Sniper
Oleg Rodin
5 (23)
M1 SNIPER 는 사용하기 쉬운 거래 지표 시스템입니다. M1 시간대에 맞춰 설계된 화살표 지표입니다. 이 지표는 M1 시간대 스캘핑을 위한 단독 시스템으로 사용할 수 있으며, 기존 거래 시스템의 일부로도 사용할 수 있습니다. 이 거래 시스템은 M1 시간대 거래용으로 특별히 설계되었지만, 다른 시간대에도 사용할 수 있습니다. 원래는 XAUUSD와 BTCUSD 거래를 위해 이 방법을 설계했지만, 다른 시장 거래에도 유용하다는 것을 알게 되었습니다. 이 지표의 신호는 추세 방향과 반대로 거래될 수 있습니다. 저는 지표의 신호를 활용하여 양방향으로 거래할 수 있도록 돕는 특별한 거래 기법을 알려드립니다. 이 방법은 특별한 동적 지지선과 저항선 가격 영역을 활용하는 것을 기반으로 합니다. 구매하시면 M1 SNIPER 화살표 지표를 바로 다운로드하실 수 있습니다. 또한, 아래 스크린샷에 표시된 Apollo Dynamic SR 지표는 M1 SNIPER 도구를 사용하는 모든 사용자에게 무료로
Gann Made Easy
Oleg Rodin
4.84 (164)
Gann Made Easy 는 mr.의 이론을 사용하여 최고의 거래 원칙을 기반으로 하는 전문적이고 사용하기 쉬운 Forex 거래 시스템입니다. W.D. 간. 이 표시기는 Stop Loss 및 Take Profit Levels를 포함하여 정확한 BUY 및 SELL 신호를 제공합니다. PUSH 알림을 사용하여 이동 중에도 거래할 수 있습니다. 구매 후 거래 방법 안내 및 유용한 추가 지표를 무료로 받으시려면 저에게 연락주세요! 아마도 Gann 거래 방법에 대해 이미 여러 번 들었을 것입니다. 일반적으로 Gann의 이론은 초보자 거래자뿐만 아니라 이미 거래 경험이 있는 사람들에게도 매우 복잡한 것입니다. Gann의 거래 방식은 이론적으로 적용하기 쉽지 않기 때문입니다. 나는 그 지식을 연마하고 Forex 지표에 최고의 원칙을 적용하기 위해 몇 년을 보냈습니다. 표시기는 적용하기가 매우 쉽습니다. 차트에 첨부하고 간단한 거래 권장 사항을 따르기만 하면 됩니다. 지표는 지속적으로 시장 분석
PRO Renko System
Oleg Rodin
5 (30)
PRO Renko System 은 RENKO 차트 거래를 위해 특별히 고안된 매우 정확한 거래 시스템입니다. 이것은 다양한 거래 상품에 적용될 수있는 보편적 인 시스템입니다. 체계는 효과적으로 당신에게 정확한 반전 신호에 접근을 주는 소위 시장 소음을 중화합니다. 이 표시기는 사용하기가 매우 쉽고 신호 생성을 담당하는 매개 변수가 하나만 있습니다. 당신은 쉽게 당신의 선택의 어떤 무역 계기에 공구를 적응시킬 수 있고 renko 막대기의 크기. 나는 항상 당신이 내 소프트웨어로 수익성있게 거래 할 수 있도록 추가 지원을 제공 할 준비가되어 있습니다! 나는 당신에게 행복하고 수익성있는 거래를 기원합니다! 구매 후 저에게 연락하십시오! 내 렌코 차트 생성기를 보내드립니다. 또한 내 개인 권장 사항 및 시스템의 다른 모듈을 무료로 공유 할 것입니다!
Trend Catcher ind
Ramil Minniakhmetov
트렌드 캐처 인디케이터 트렌드 캐처 인디케이터는 개발자가 자체 개발한 맞춤형 적응형 트렌드 분석 지표들을 조합하여 시장 가격 움직임을 분석합니다. 단기적인 노이즈를 제거하고 근본적인 모멘텀 강도, 변동성 확대, 가격 구조 움직임에 집중하여 진정한 시장 방향을 파악합니다. 또한 이동 평균, RSI, 변동성 필터와 같은 맞춤형 지표들을 활용하여 가격을 평활화하고 트렌드를 필터링합니다. 실제 운영 모니터링 및 기타 제품은 다음 링크에서 확인하실 수 있습니다: https://www.mql5.com/en/users/mechanic/seller 텔레그램에서는 EA나 설정 파일을 판매하지 않습니다. 사기이니 주의하세요. 모든 설정 파일은 블로그에서 무료로 제공됩니다. 중요! 구매 후 즉시 연락 주시면 사용 방법 및 보너스를 드립니다!
Trend Lines PRO
Roman Podpora
5 (1)
트렌드 라인즈 프로       이 지표는 시장이 실제로 어떤 방향으로 전환되는지 파악하는 데 도움이 됩니다. 실제 추세 반전 지점과 주요 시장 참여자들이 다시 진입하는 지점을 보여줍니다. 보시다시피       BOS 라인       복잡한 설정이나 불필요한 노이즈 없이 더 높은 시간대의 추세 변화와 주요 레벨을 확인할 수 있습니다. 신호는 차트에 다시 그려지지 않고 캔들이 마감된 후에도 계속 표시됩니다. VERSION MT 5   -   RFI LEVELS PRO   표시기   와 결합할 때 최대 잠재력을 발휘합니다. 지표가 보여주는 내용: 실제 변화       추세(BOS 라인) 한 번 신호가 나타나면 그 신호는 계속 유효합니다! 이는 신호를 발생시킨 후 변경될 수 있는 리페인팅 방식의 지표와 중요한 차이점입니다. 리페인팅 방식의 지표는 잠재적으로 자금 손실로 이어질 수 있습니다. 이제 더욱 높은 확률과 정확도로 시장에 진입할 수 있습니다. 또한 화살표가 나타난 후 목표가(익절)
Enigmera
Ivan Stefanov
5 (8)
ENIGMERA: 시장의 핵심 중요: MQL5.com의 데모는 Strategy Tester에서 실행되며 Enigmera의 기능을 완전히 반영하지 못할 수 있습니다. 설명, 스크린샷 및 비디오를 확인하여 자세한 내용을 확인하십시오. 질문이 있으면 언제든지 메시지를 보내주세요! 인디케이터의 코드는 완전히 다시 작성되었습니다. 버전 3.0은 새로운 기능을 추가하고 인디케이터가 처음 출시된 이후 누적된 버그를 수정했습니다. 소개 이 인디케이터 및 거래 시스템은 금융 시장에 대한 주목할 만한 접근 방식입니다. ENIGMERA는 프랙탈 주기를 사용하여 정확하게 지원 및 저항 수준을 계산합니다. 실제 축적 단계를 보여주고 방향과 목표를 제공합니다. 트렌드와 수정 모두에서 작동하는 시스템입니다. 작동 방식 인디케이터의 대부분의 기능은 차트 왼쪽에 있는 버튼을 통해 제어되며, 이를 통해 다양한 시장 상황에 빠르게 대응할 수 있습니다. 버튼 ON/OFF – 인디케이터 전체를 표시하거나 숨깁니다.
Dynamic Forex28 Navigator
Bernhard Schweigert
4.43 (7)
Dynamic Forex28 Navigator - 차세대 외환 거래 도구. 현재 49% 할인. Dynamic Forex28 Navigator는 오랫동안 인기 있는 지표의 진화형으로, 세 가지의 힘을 하나로 결합했습니다. 고급 통화 Strength28 지표(695개 리뷰) + 고급 통화 IMPULSE with ALERT(520개 리뷰) + CS28 콤보 신호(보너스). 지표에 대한 자세한 정보 https://www.mql5.com/en/blogs/post/758844 차세대 Strength 지표는 무엇을 제공합니까?  원래 지표에서 좋아했던 모든 것이 새로운 기능과 더 높은 정확도로 강화되었습니다. 주요 기능: 독점적인 통화 Strength 공식.  모든 시간대에 걸쳐 부드럽고 정확한 강도선. 추세와 정확한 진입을 식별하는 데 이상적입니다. 역동적인 시장 피보나치 수준(시장 피보나치).  이 지표에만 있는 고유한 기능. 가격 차트가 아닌 통화 강도에 피보나치가 적용됩니다.
Genesis Matrix Pro is a professional multi-timeframe trend detection indicator designed to help traders identify high-quality market alignment with clarity and structure. It combines 12 different technical indicators into one visual alignment matrix, allowing traders to quickly see when market conditions are bullish, bearish, or neutral. A signal is generated only when the selected strategies are aligned, helping reduce noise and improve decision-making. PLEASE CONTACT ME AFTER PURCHASE TO GET
이 지표는 실제 거래에 완벽한 자동 파동 분석 지표입니다! 사례... 참고:   웨이브 그레이딩에 서양식 이름을 사용하는 데 익숙하지 않습니다. Tang Lun(Tang Zhong Shuo Zen)의 명명 규칙의 영향으로 기본 웨이브를   펜   으로 명명하고 2차 웨이브 밴드를   세그먼트   로 명명했습니다. 동시에, 세그먼트에는 추세 방향이 있습니다.   주요 추세 세그먼트에는   이름이 지정되지만(이 이름 지정 방법은 향후 노트에서 사용됩니다. 먼저 말씀드리겠습니다.) 알고리즘은 굴곡 이론과 거의 관련이 없으므로 그렇게 해서는 안 됩니다. 이는 나의 시장 분석을   통해 요약된 끊임없이 변화하고 복잡한 운영 규칙을   반영합니다. 밴드는 더 이상 사람마다 다르지 않도록 표준화되고 정의되었습니다. 인위적인 간섭의 드로잉 방법은 시장 진입을 엄격하게 분석하는 데 핵심적인 역할을 합니다. 이 지표를 사용하는 것은 거래 인터페이스의 미학을 개선하고 원래의 K-line 거래를
RFI levels PRO
Roman Podpora
5 (1)
이 지표는 추세 반전 지점과 가격 반등 영역을 정확하게 보여줍니다.       주요 투자자들   . 새로운 트렌드가 형성되는 곳을 파악하고 최대한 정확하게 의사결정을 내리며 모든 거래를 완벽하게 통제합니다. TREND LINES PRO   지표와 함께 사용할 때 최대의 잠재력을 발휘합니다.  VERSION MT5 지표가 보여주는 내용: 새로운 추세의 시작 시 활성화되는 반전 구조 및 반전 수준. 최소한의 위험 대비 수익률을 갖는 이익 실현   (TAKE PROFIT)   및   손절매(STOP LOSS)   레벨 표시       RR 1:2   . 지능형 손실 감소 로직이 적용된 손절매 기능. 지정된 지표에서 두 가지 추세 유형에 대한 반전 패턴을 표시합니다. 지표: 트렌드를 따라   트렌드 라인 프로   (글로벌 트렌드 변화) 트렌드 프로   (빠른 트렌드 변화) 간단하고 효과적입니다       스캐너       실시간 추세 (신규). 다중 시간 프레임 도구 필터링. 표시하다  
이 제품은 2026년 시장에 맞게 업데이트되었으며 최신 MT5 빌드에 최적화되었습니다. 가격 업데이트 안내: Smart Trend Trading System은 현재 $99 에 제공됩니다. 다음 30회 구매 후 가격은 $199 로 인상됩니다. 특별 혜택: Smart Trend Trading System 구매 후 저에게 개인 메시지를 보내시면 Smart Universal EA를 무료 로 받을 수 있으며, Smart Trend 신호를 자동 거래로 전환할 수 있습니다. Smart Trend Trading System은 리페인트 없음, 재그리기 없음, 지연 없음의 완전한 트레이딩 시스템으로, 더 깨끗한 신호, 더 나은 추세 방향, 그리고 더 체계적인 시장 거래 방식을 원하는 트레이더를 위해 제작되었습니다. Online course , manual and download presets . 이 시스템은 추세 감지, 반전 구간, Smart Cloud, 트레일링 스톱 로직, 지지와 저항, 캔들 색
MTF Supply Demand Zones
Georgios Kalomoiropoulos
4.82 (22)
자동화된 수요 및 공급 구역의 차세대. 모든 차트에서 작동하는 새롭고 혁신적인 알고리즘. 모든 구역은 시장의 가격 움직임에 따라 동적으로 생성됩니다. 두 가지 유형의 경고 --> 1)가격이 영역에 도달할 때 2)새로운 영역이 형성될 때 당신은 더 이상 쓸모없는 지표를 얻을 수 없습니다. 입증된 결과로 완벽한 거래 전략을 얻을 수 있습니다.     새로운 기능:     가격이 공급/수요 영역에 도달하면 경고     새로운 공급/수요 구역이 생성되면 알림     푸시 알림 알림     핍의 영역 너비 레이블     기동특무부대에 한 번 더 시간이 주어집니다. 따라서 현재보다 위의 2개의 시간 프레임 대신 현재보다 높은 3개의 시간 프레임을 볼 수 있습니다.     Alerts/Zones/MTF 기능을 활성화/비활성화하는 버튼 당신이 얻는 이점:     거래에서 감정을 제거하십시오.     거래 항목을 객관화하십시오.     높은 확률 설정을 사용하여 수익
PZ Trend Trading
PZ TRADING SLU
4.8 (5)
Capture every opportunity: your go-to indicator for profitable trend trading Trend Trading is an indicator designed to profit as much as possible from trends taking place in the market, by timing pullbacks and breakouts. It finds trading opportunities by analyzing what the price is doing during established trends. [ Installation Guide | Update Guide | Troubleshooting | FAQ | All Products ] Trade financial markets with confidence and efficiency Profit from established trends without getting whips
Step into the world of Forex trading with confidence, clarity, and precision using   Gold Indicator   a next-generation tool engineered to take your trading performance to the next level. Whether you’re a seasoned professional or just beginning your journey in the currency markets, Gold Indicator equips you with powerful insights and help you trade smarter, not harder. Built on the proven synergy of three advanced indicators, Gold Indicator focuses exclusively on medium and long-term trends eli
Entry Points Pro
Yury Orlov
4.59 (174)
다시 색을 칠하지 않고 거래에 진입할 수 있는 정확한 신호를 제공하는 MT4용 지표입니다. 외환, 암호화폐, 금속, 주식, 지수 등 모든 금융 자산에 적용할 수 있습니다. 매우 정확한 추정값을 제공하고 매수와 매도의 가장 좋은 시점을 알려줍니다. 하나의 시그널로 수익을 내는 지표의 예와 함께 비디오 (6:22)시청하십시오! 대부분의 거래자는 Entry Points Pro 지표의 도움으로 첫 거래 주 동안 트레이딩 결과를 개선합니다. 저희의   Telegram Group 을 구독하세요! Entry Points Pro 지표의 좋은점. 재도색이 없는 진입 신호 신호가 나타나고 확인되면(시그널 캔들이 완성된 경우) 신호는 더 이상 사라지지 않습니다. 여타 보조지표의 경우 신호를 표시한 다음 제거되기 때문에 큰 재정적 손실로 이어집니다. 오류 없는 거래 게시 알고리즘을 통해 트레이드(진입 또는 청산)를 할 이상적인 순간을 찾을 수 있으며, 이를 통해 이를 사용하는 모든 거래자의 성공률이
MetaBands M4
Vahidreza Heidar Gholami
3.5 (6)
MetaBands uses powerful and unique algorithms to draw channels and detect trends so that it can provide traders with potential points for entering and exiting trades. It’s a channel indicator plus a powerful trend indicator. It includes different types of channels which can be merged to create new channels simply by using the input parameters. MetaBands uses all types of alerts to notify users about market events. Features Supports most of the channel algorithms Powerful trend detection algorith
M30/H1/H4 스윙 버전 출시 큰 움직임을 잡고 싶으신가요? Gold Signal Swing Pro (M30/H1/H4). 목표: 거래당 $20-$80+. https://www.mql5.com/en/market/product/177643 KURAMA GOLD SIGNAL PRO (MT4) — 7층 필터, 자동 TP/SL, 품질 점수를 탑재한 XAUUSD 완벽 트레이딩 시스템 리페인트 없음. 리드로우 없음. 지연 없음. 모든 신호는 영구적입니다. 보이는 것이 그대로입니다. 보너스: 영구 라이선스 구매자에게 AI Zone Radar ($59 상당) + 전체 PDF 매뉴얼을 무료 제공. 구매 후 메시지를 보내주세요. AI Zone Radar: https://www.mql5.com/en/market/product/175834 트레이더의 신뢰: 활발한 골드 트레이더 커뮤니티에서 이미 사용 중. 정확도와 사
Current event:  https://c.mql5.com/1/326/A2SR2025_NoMusic.gif A. A2SR이란 무엇입니까 ?   * 선행 기술 지표입니다(재도장 없음, 지연 없음). -- 안내 : https://www.mql5.com/en/blogs/post/734748/page4#comment_16532516 -- 및 https://www.mql5.com/en/users/yohana/blog A2SR에는 지원(수요) 및 저항(공급) 수준을 결정하는 특별한 기술이 있습니다. 우리가 인터넷에서 본 일반적인 방식과 달리 A2SR은 실제 SR 수준을 결정하는 독창적인 개념을 가지고 있습니다. 원래 기술은 인터넷에서 가져온 것이 아니며 인터넷에 게시된 적도 없습니다. A2SR은 거래 스타일에 따라 SR 수준을 자동으로 선택합니다. 시간 프레임을 변경해도 SR 레벨은 그대로 유지됩니다. 사용하는 시간 프레임에서 실제 SR을 얻지 못하기 때문입니다. A2SR은 거래를
BTMM State Engine Pro MT4
Garry James Goodchild
BTMM State Engine Pro is a MetaTrader 4 indicator for traders who use the Beat The Market Maker approach: Asian session context, kill zone timing, level progression, peak formation detection, and a multi-pair scanner from a single chart. It combines cycle state logic with a built-in scanner dashboard so you do not need the same tool on many charts at once. What it does Draws the Asian session range; session times can follow broker server offset or be set in inputs. Tracks level progression (L
Quant Direction
Georgios Kalomoiropoulos
Quant Direction 은 3D 시장 분석 도구입니다. 다양한 매개변수에 걸쳐 정확한 백분율 편차를 계산하면서 완벽하게 객관적인 알고리즘 기반 시장 분석을 제공합니다. 첨단 AI 기반 모델링 도구와 엄격한 테스트를 거쳐 개발된 이 알고리즘은 타의 추종을 불허하는 정확도로 시장을 분석합니다. 플랫폼에서 모든 통화쌍 또는 금융 상품을 분석할 수 있습니다. 단기 거래, 데이 트레이딩, 스윙 트레이딩 등 어떤 유형의 거래를 하든 Quant Direction은 최적의 선택입니다. 운영자가 되는 것의 진정한 이점 퀀트 디렉션의 진정한 장점은 감정, 눈의 피로, 과도한 분석을 완전히 배제한다는 점입니다. 더 이상 수십 개의 차트를 일일이 살펴보며 방향을 찾거나 자신의 판단에 끊임없이 의문을 품을 필요가 없습니다. 이 시스템은 8개의 시간 간격(5개월에서 수개월까지)을 밀리초 단위로 처리합니다. 특정 시점의 주요 시장 참여자를 정확하게 식별하여 항상 성공 확률이 가장 높은 방향으로 거래할
MonsterDash Harmonic Indicator
Paul Geirnaerdt
4.54 (26)
MonsterDash Harmonic Indicator is a harmonic pattern dashboard. It recognizes all major patterns. MonsterDash is a dashboard that displays all detected patterns for all symbols and (almost) all timeframes in sortable and scrollable format. Users can add their own user defined patterns . MonsterDash can open and update charts with the pattern found. Settings MonsterDash's default settings are good enough most of the time. Feel free to fine tune them to your needs. The color settings are for thos
NAM Order Blocks
NAM TECH GROUP, CORP.
3.67 (3)
MT4 Multi-timeframe Order Blocks detection indicator. Features - Fully customizable on chart control panel, provides complete interaction. - Hide and show control panel wherever you want. - Detect OBs on multiple timeframes. - Select OBs quantity to display. - Different OBs user interface. - Different filters on OBs. - OB proximity alert. - ADR High and Low lines. - Notification service (Screen alerts | Push notifications). Summary Order block is a market behavior that indicates order collection
PowerBall Signals
Oleg Rodin
5 (4)
PowerBall Signals는 지지/저항 영역을 사용한다는 아이디어를 기반으로 한 매수/매도 신호 표시기입니다. 이 지표는 지지/저항 영역을 기반으로 특별한 반전 패턴을 감지하고 차트에 이러한 신호를 제공합니다. 이 지표의 주요 아이디어는 MTF(다중 시간대) 분석을 사용하고 현재 및 다음 상위 시간대의 수준을 기반으로 신호를 제공하는 것입니다. 이 방법을 사용하면 통화, 금속, 지수 또는 암호화폐 등 모든 시장에서 가능한 가격 반전을 예측할 수 있습니다. 반전 신호 외에도 이 지표는 거래 중에 추세를 유지할 수 있는 추세 지속 신호도 제공합니다. 이 지표는 외환 및 바이너리 옵션 거래자 모두에게 도움이 될 것입니다. NON-MTF 또는 MTF 모드에서 표시기를 사용할지 여부를 선택할 수 있습니다. 신호 생성을 위해 데이터를 가져오려는 소스 시간 프레임을 선택할 수도 있습니다. 거래 팁과 큰 보너스를 얻으려면 구매 후 저에게 연락하십시오! 행복하고 수익성 있는 거래를 기원합니다!
Auto Optimized Parabolic RSI: 고급 3D 모멘텀 엔진 대부분의 개인 투자자용 보조지표는 시장의 변동성이 변하는 순간 무용지물이 되는 정적인 입력값에 의존하기 때문에 실패합니다. Auto Optimized Parabolic RSI는 자체적인 수학적 우위를 지속적으로 재계산하여 "보조지표 노후화" 문제를 해결하며, 기관급 퀀트 트레이딩의 적응력을 귀하의 MT5 터미널에 직접 제공합니다. 핵심 이점: 맞춤형 인메모리 3D 최적화   표준 자동 최적화 도구들은 일반적인 보조지표 호출로 터미널에 과부하를 일으켜 MT5 플랫폼을 멈추게 하는 경우가 많습니다. 이 도구는 이러한 병목 현상을 완전히 우회합니다. 맞춤형 네이티브 RAM 기반 계산기로 구축된 내부 엔진은 차트를 로드하거나 타임프레임을 변경할 때마다 빛처럼 빠른 3D 그리드 검색을 실행합니다. RSI 기간(주기), SAR 스텝(가속도) 및 SAR 최대치(속도 제한)를 동시에 스캔하여 플랫폼 지연 없이 수만 개의
Volume Master
Mohamed Hassan
Volume Master – Real-Time Market Power Indicator See who’s in control of the market: buyers or sellers in real time. Volume Master is a powerful trading tool designed to give you a clear edge by visualizing bull vs bear activity across multiple symbols, while helping you confirm high-probability entries directly on your chart. WHAT MAKES VOLUME MASTER DIFFERENT? Unlike traditional volume indicators, Volume Master doesn’t just show volume — it shows market dominance. Real-Time Bull vs Bear Activi
GoldRush Trend Arrow Signal
Kirk Lee Holloway
5 (2)
GoldRush 트렌드 화살표 신호 GoldRush 트렌드 화살표 신호 지표는 XAU/USD 시장에서 고속 단기 스캘핑 트레이더를 위해 설계된 정밀한 실시간 트렌드 분석을 제공합니다. 1분 시간대에 특화되어 설계된 이 도구는 명확한 진입점을 표시하는 방향성 화살표를 제공하여 스캘퍼들이 변동성이 높은 시장 환경에서도 자신 있게 거래할 수 있도록 합니다. 이 지표는 PRIMARY 및 SECONDARY 경고 화살표로 구성됩니다. PRIMARY 신호는 추세 방향의 변화를 나타내는 흰색과 검은색 방향성 화살표이며, SECONDARY 신호는 PRIMARY 화살표가 지시하는 방향을 확인하고 잠재적인 거래 진입점을 표시하는 파란색과 빨간색 화살표입니다. 참고: 추세 방향이 변경된 후 PRIMARY 경고 화살표가 단 하나만 표시될 경우, 다수의 SECONDARY 파란색/빨간색 화살표가 표시될 수 있음을 유의해야 합니다. SECONDARY 신호는 신호 기준을 충족하는 어떤 캔들 이후에도 표시
PZ 123 Pattern
PZ TRADING SLU
1 (1)
Unlock powerful breakout opportunities The 123 Pattern is one of the most popular, powerful and flexible chart patterns. The pattern is made up of three price points: a bottom, a peak or valley, and a Fibonacci retracement between 38.2% and 71.8%. A pattern is considered valid when the price breaks beyond the last peak or valley, moment at which the indicator plots an arrow, rises an alert, and the trade can be placed. [ Installation Guide | Update Guide | Troubleshooting | FAQ | All Products  ]
Bull versus Bear
Mohamed Hassan
4.5 (18)
Send us a message after your purchase to receive more information on how to get your  BONUS  for FREE  that works in great combination with Bull vs Bear ! Bull versus Bear is an easy-to-use Forex indicator that gives traders clear and accurate signals based on clear trend retests . Forget about lagging indicators or staring at charts for hours because  Bull vs Bear provides real-time entries with no lag and no repaint, so you can trade with confidence. Bull vs Bear  helps you enter trades during
제작자의 제품 더 보기
Lisek Levels and Channels Indicator
Darius Hans Lischka
4.8 (20)
Are you ready to become the Sherlock Holmes of forex trading? ️‍️ Introducing the ultimate trading toolkit:   Lisek Levels and Channels   Indicator !!! Forget juggling multiple indicators like a circus act. We've packed everything you need into one spectacular show: Price Levels? Check! Price Channels? You bet! Price VWAP? Oh yeah! Volume On Balance? It's all there! And the cherry on top? Alarms and Push Notifications that'll wake you up faster than a double espresso! ️ Your cha
FREE
Lisek ATR Levels
Darius Hans Lischka
5 (3)
Are you looking for  ATR Levels,   ATR Trend, ATR Support and Resistance  Indicators ? Now you have all in one !!!  Info on your chart is showing you: where current price and levels are, what is current trend and signals. Search for an entry with low risk for trading by Lisek ATR Indicator. There are many ways to trade with Lisek ATR Indicator: Trade Support and Resistance Levels. Trade pullbacks (Range trading). Trade breakouts. Trade reversals. Take profit or set stop-loss based on ATR Levels.
FREE
Lisek Levels EA
Darius Hans Lischka
4.4 (5)
Simple but powerfull Trend and Hedge EA for Lisek Levels and Channels Indicator . 1. Download Lisek Levels and Channels Indicator . 2. Backtest and optimize in Strategy Tester. 3. For Agressive Tick Mode set your Chart to M1 Time Frame. 4. To speed up Strategy Tester, set "Show Info" to   false   ! 5. After backtesting, it’s important to analyse the test results  (best profit and smallest drawdown). 6. Test your EA settings on Demo Account. Happy Trading !!!
FREE
Lisek Weis Wave
Darius Hans Lischka
5 (3)
This Weis Wave Volume indicator is a tool to help traders identify the current price trend.  Understanding volume can provide insight into a market's behavior to help you determine its overall health. The most important rule is this: volume precedes price. Typically, before a market price moves, volume comes into play. It has 2 main colors histogram which are green and red. – Green indicates an upward wave. The more the price increases, the bigger the green volume gets. – The red color shows a d
FREE
Lisek Multi MA
Darius Hans Lischka
5 (1)
Search for an entry with low risk for trading by Lisek Moving Average Indicator. There are many ways to trade with Lisek Moving Average Indicator: Trend continuation (Trend trading). Trade pullbacks (Range trading). Trade breakouts. Trade reversals. Take profits or set stop-loss based on your MA. Moving Averages are a frequently used technical indicator in forex trading, especially over 10, 50, 100, and 200 periods. Moving Averages are lagging indicators, which means they don't predict where p
FREE
Lisek Waves
Darius Hans Lischka
4 (1)
Search for an entry with low risk for trading by Lisek Waves Indicator. Using Lisek Waves Indicator can improve your trading performance. In it’s simplest form, this trading tool make it easy to s earch for an entry with low risk   and to manage your trade and risk. Lisek Wave analysis is based on the notion that markets follow specific patterns called waves which are the result of a natural rhythm of crowd psychology that exists in all markets. You can avoid the loss from taking trades that are
FREE
Lisek Stochastic
Darius Hans Lischka
2.83 (6)
Lisek Stochastic   oscillator indicator with Alarm, Push Notifications and e-mail  Notifications. The Stochastic indicator is a momentum indicator that shows you how strong or weak the current trend is. It helps you identify overbought and oversold market conditions within a trend. The Stochastic indicator is lagging indicator, which means it don't predict where price is going, it is only providing data on where price has been !!! How to trade with Stochastic indicator: Trend following: As long
FREE
Simple ATR StopLoss
Darius Hans Lischka
Simple ATR Stop Loss : 당신의 시장 변동성 나침반 으로, 거래의 험난한 바다를 항해하고 , 더 똑똑한 손절매 를 설정하며 당신을 거래의 닌자처럼 보이게 만듭니다 (망토는 포함되지 않음). 모든 거래 애호가와 시장 전문가 여러분, 주목해주세요! Simple ATR Stop Loss 지표를 소개합니다 – 거친 거래 세계의 새로운 친구죠. 두 조각 퍼즐보다 간단하지만 , 카페인 과다 섭취한 황소가 도자기 가게에 들어간 것보다 강력합니다. ATR 거래 치트 시트 (또는 시장 파도를 타고 넘어지지 않는 방법) ‍️: ATR: 당신의 시장 무드 해독기 ️‍️ ATR을 당신 시장의 트위터 피드라고 생각하세요. 높은 값? 트윗 폭풍 모드입니다. 낮은 값? 무음 모드죠. 이 정보를 사용해 뛰어들지 아니면 해안에서 지켜볼지 결정하세요. ‍️ 올바른 사이징과 조준 ATR을 당신의 거래 재단사이자 표적 연습 코치로 삼
FREE
필터:
2100198528
317
2100198528 2026.04.17 22:13 
 

사용자가 평가에 대한 코멘트를 남기지 않았습니다

리뷰 답변