Fibo Linear Channel
- Indicatori
- Versione: 1.21
- Aggiornato: 26 marzo 2020
- Attivazioni: 5

Colored indicator of the linear channel based on the Fibonacci sequence. It is used for making trading decisions and analyzing market sentiment. The channel boundaries represent strong support/resistance levels, as they are the Fibonacci proportion levels.
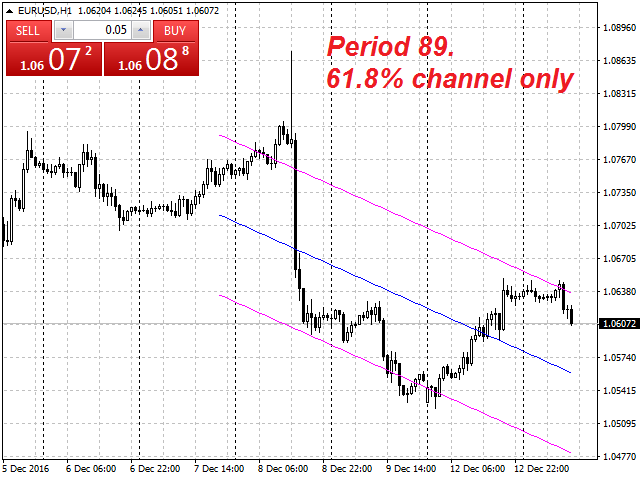
Users can select the number of displayed lines of channel boundaries on the chart by means of the input parameters.
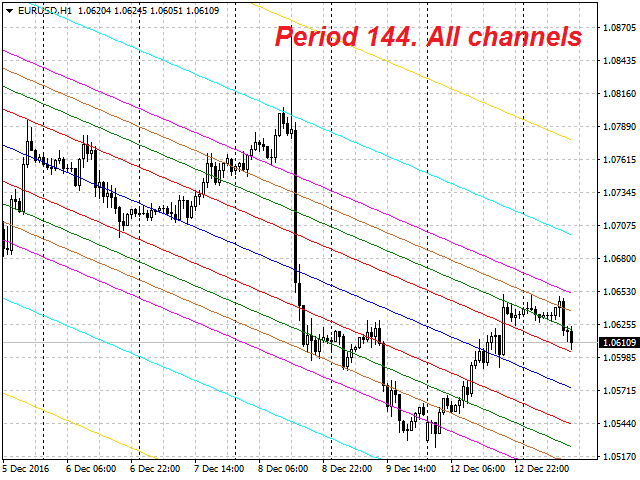
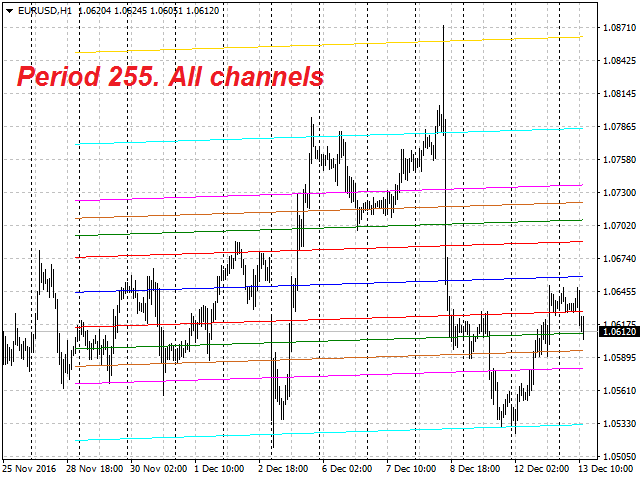
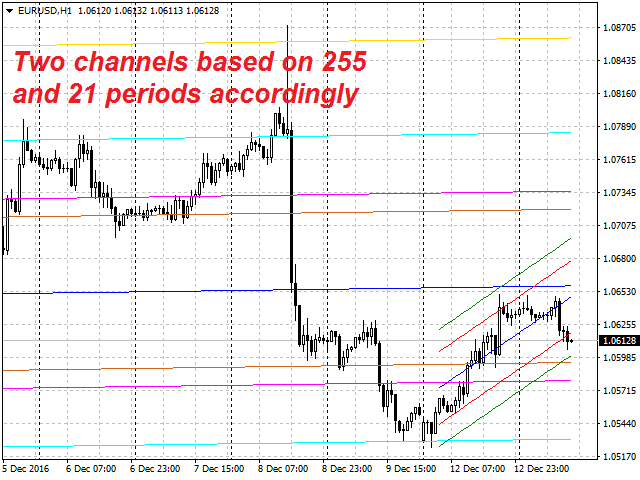
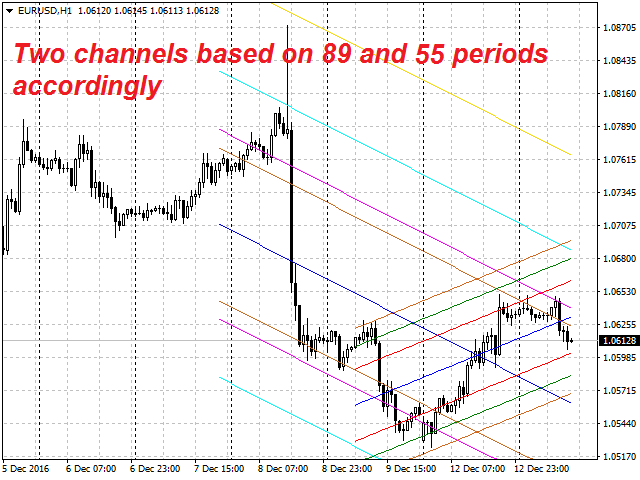
Attaching multiple instances of the indicator to the chart with different calculation periods leads to displaying a system of channels on the chart.
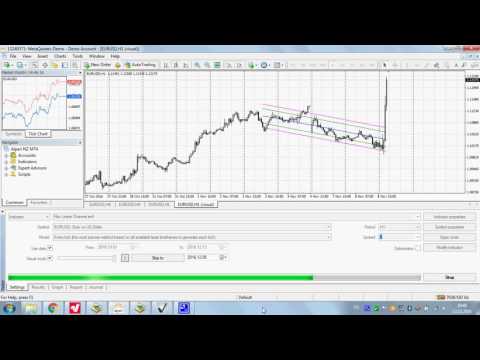
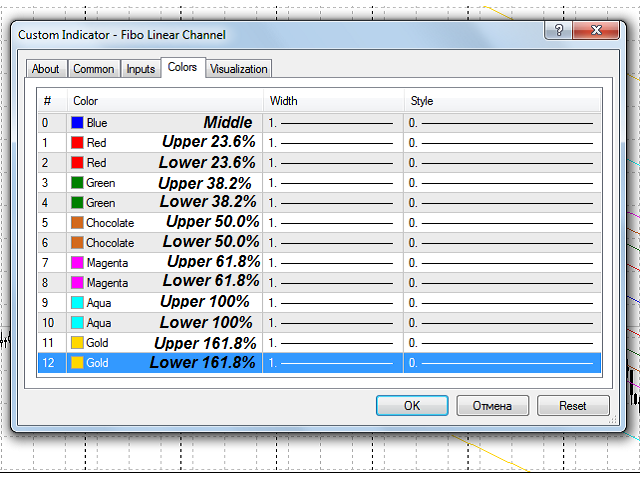
Operation and various application options of the indicator are shown in the screenshots and in the attached video. The middle of the channel is shown in blue. The channel boundaries are displayed in individual color in pairs for each corresponding Fibonacci extension.
Excellent interaction is achieved in conjunction with the Linear Regression Global indicator.
Purpose
The indicator can be used for manual or automated trading within an Expert Advisor. Values of indicator buffer of the double type can be used for automated trading:
- Channel middle line - buffer 0.
- Upper 23.6% boundary line - buffer 1.
- Lower 23.6% boundary line - buffer 2.
- Upper 38.2% boundary line - buffer 3.
- Lower 38.2% boundary line - buffer 4.
- Upper 50.0% boundary line - buffer 5.
- Lower 50.0% boundary line - buffer 6.
- Upper 61.8% boundary line - buffer 7.
- Lower 61.8% boundary line - buffer 8.
- Upper 100.0% boundary line - buffer 9.
- Lower 100.0% boundary line - buffer 10.
- Upper 161.8% boundary line - buffer 11.
- Lower 161.8% boundary line - buffer 12.
Values of the buffers must not be equal to zero.
Input parameters
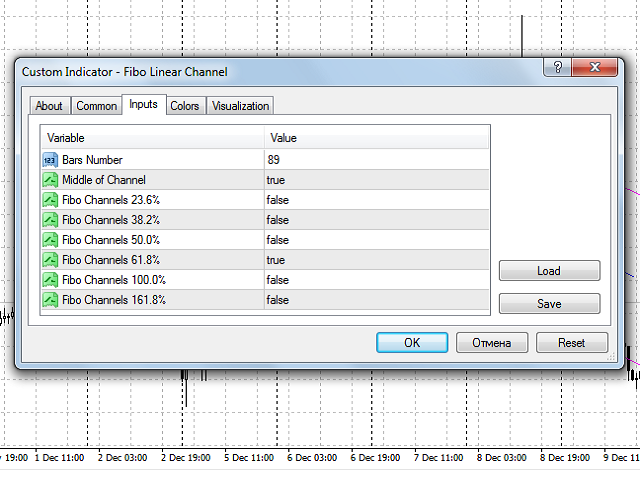
- Bars_Number - number of bars for the indicator calculation.
- Middle of Channel - Display the channel middle on the chart:
- true - yes.
- false - no.
- Fibo Channels 23.6% ....... Fibo Channels 161.8% - Display the 23.6% ........ 161.8% channel boundaries on the chart:
- true - yes.
- false - no.


The indicator was a good tool to identify trends and also the key resistance levels