Volume POC
- Indicatori
-
Chantal Sala
 Hi, I'm a programmer (female) from 1995 and in MQL4 from 2008.
I have released most of 2500 Expert Advisor/Indicators and Dashboard.
I have worked with many famous italian traders to automate their strategy. - Versione: 2.1
- Aggiornato: 30 agosto 2022
- Attivazioni: 10
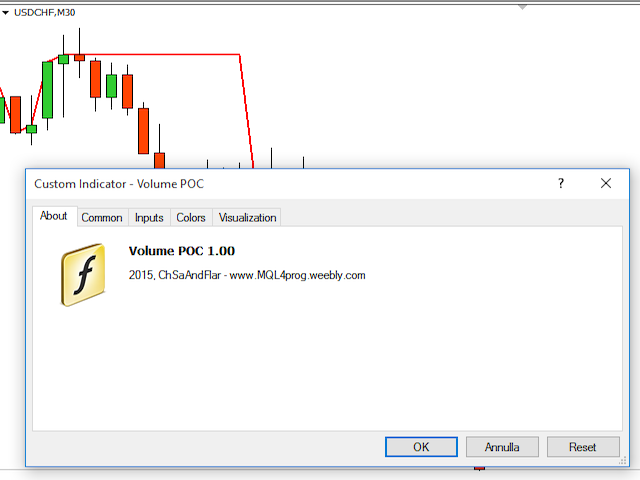
Volume POC
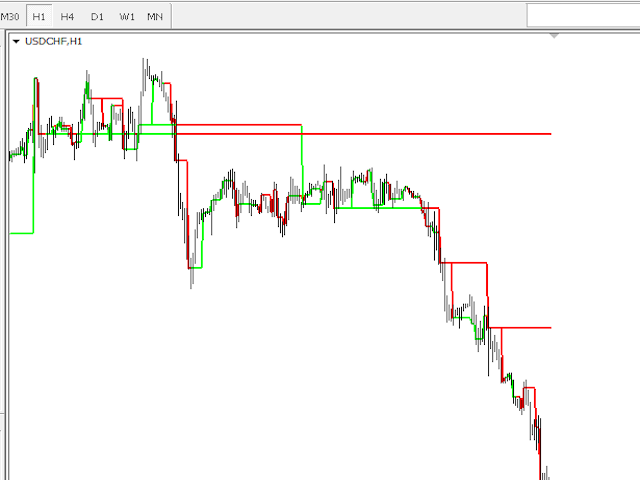
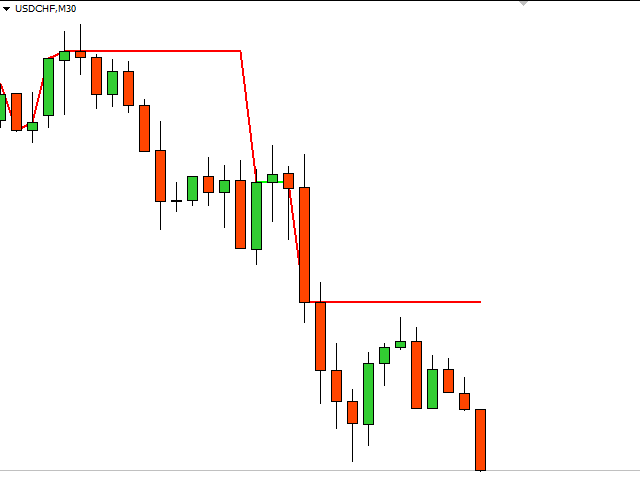
L'indicatore Volume POC mostra livelli importanti. Puoi usarlo come un sistema di trading indipendente.
Le funzioni di avviso alla chiusura di una candela ti consentono di avere alcune informazioni sulla direzione del mercato.
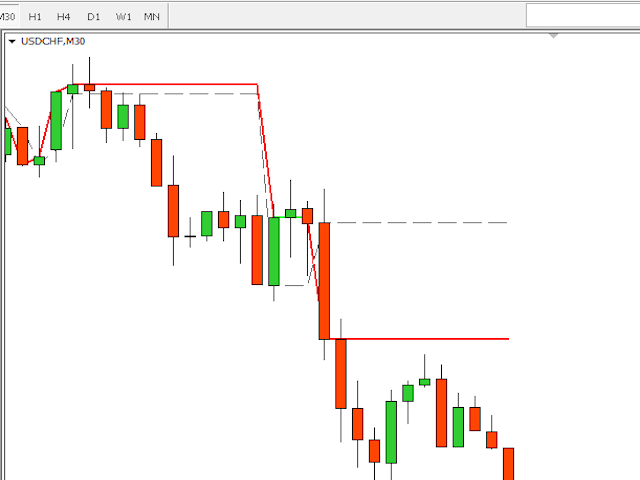
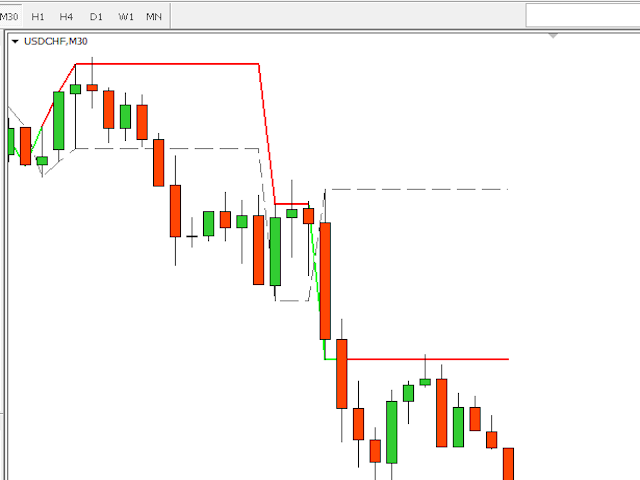
La visualizzazione grafica è semplice ed efficace. I livelli riportati sono il risultato dello studio dei volumi storici di mercato.
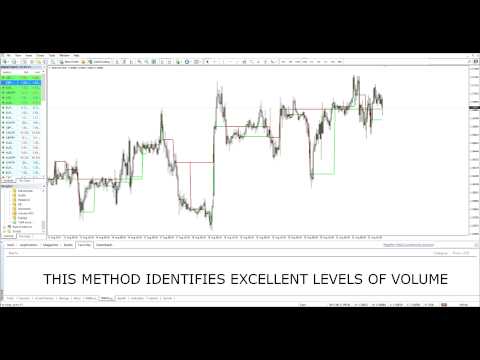
Questi livelli offrono ottimi punti di ingresso e ottimi livelli di supporto e resistenza.
È possibile utilizzare l'indicatore anche su tempi molto bassi. È adatto a coloro che desiderano effettuare operazioni a breve termine.
Tuttavia, si consiglia di utilizzare l'indicatore per cercare POC su D1, W1 e MN.
Usando correttamente questo indicatore avrai la possibilità di identificare facilmente i livelli di prezzo chiave.
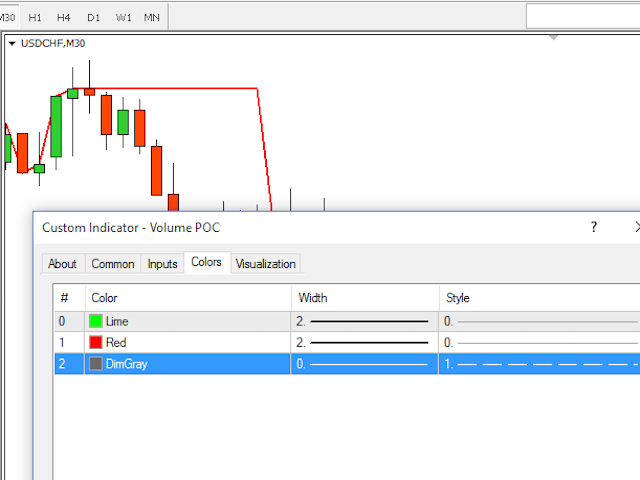
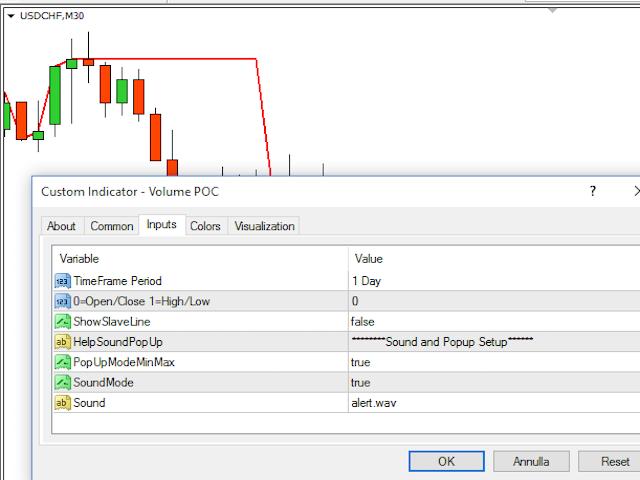
Paramentri Input:
- TimeFrame – periodo analizzato
- 0=Apri/Chiudi, 1=Alto/Basso (posizione buffer)
- Configurazione audio e popup (ON/OFF, wav)

Thank you for this Volume POC which I find most useful. However I wished there's an option for an outright purchase instead of a maximum rental period of a year.