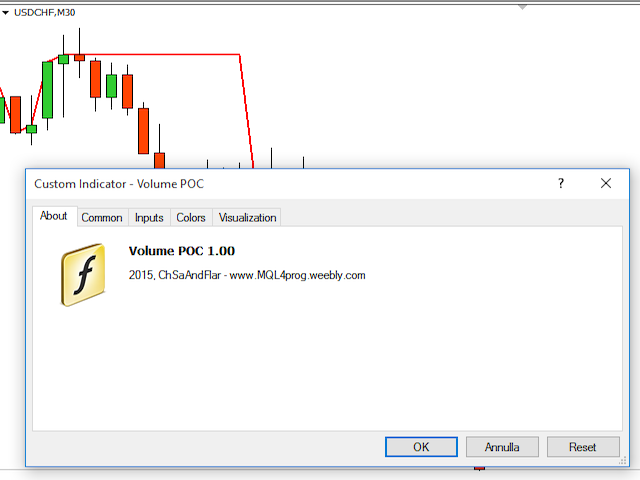
Volume POC
- インディケータ
-
Chantal Sala
 Hi, I'm a programmer (female) from 1995 and in MQL4 from 2008.
I have released most of 2500 Expert Advisor/Indicators and Dashboard.
I have worked with many famous italian traders to automate their strategy. - バージョン: 2.1
- アップデート済み: 30 8月 2022
- アクティベーション: 10
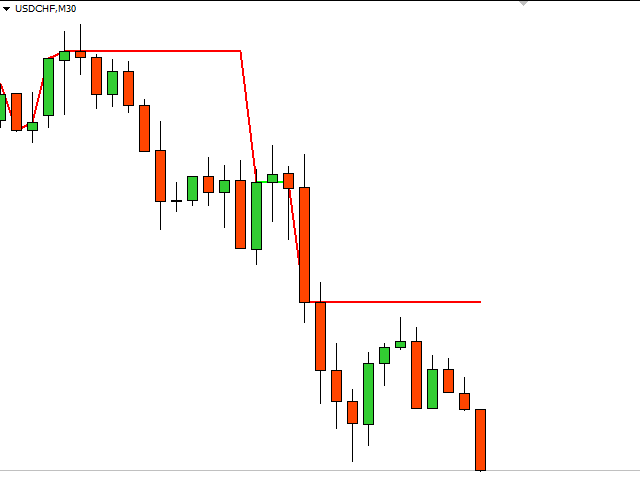
Volume POC
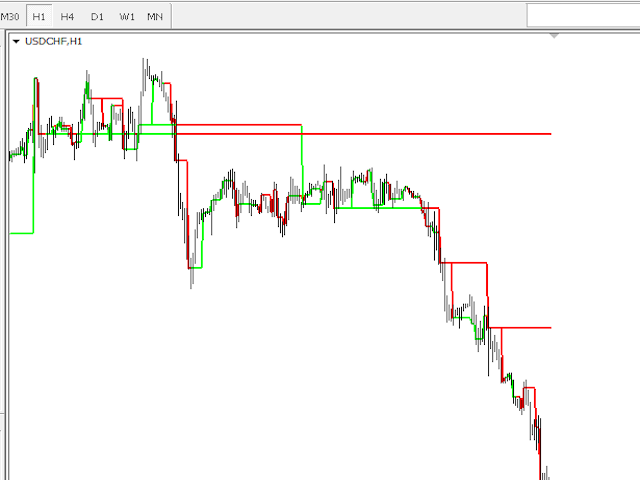
The Volume POC indicator displays important levels. You can use it as an independent trading system.
Warning functions at a candle closing allow you to have some information on the market direction.
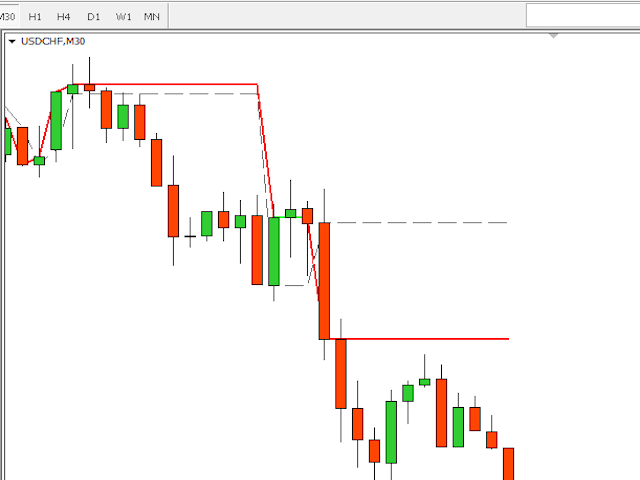
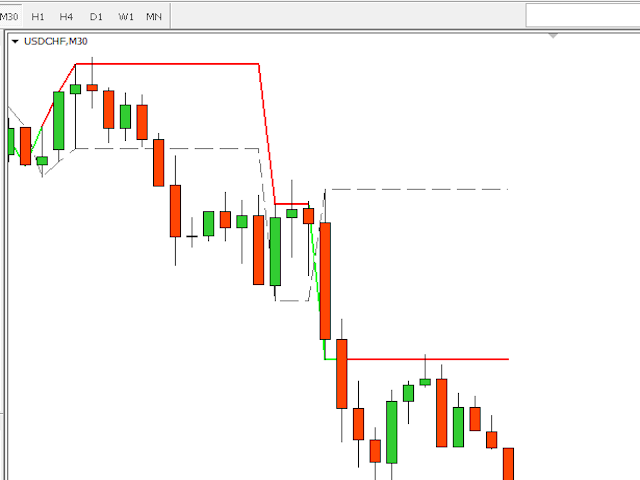
The graphical display is simple and effective. The levels reported are the result of the study of historical market volumes.
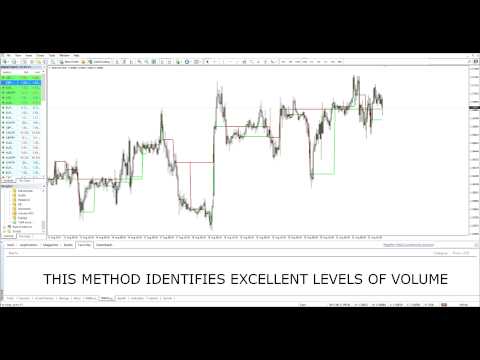
These levels give excellent entry points and excellent levels of support and resistance.
You can use the indicator also on very low timeframes. It is suitable for those who wish to make short-term operations.
However, we recommend using the indicator searching POC on D1, W1 and MN.
Using properly this indicator you will have the ability to identify key price levels easily.
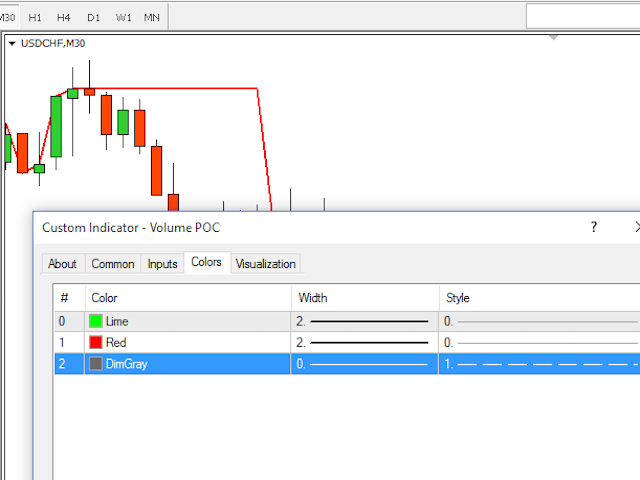
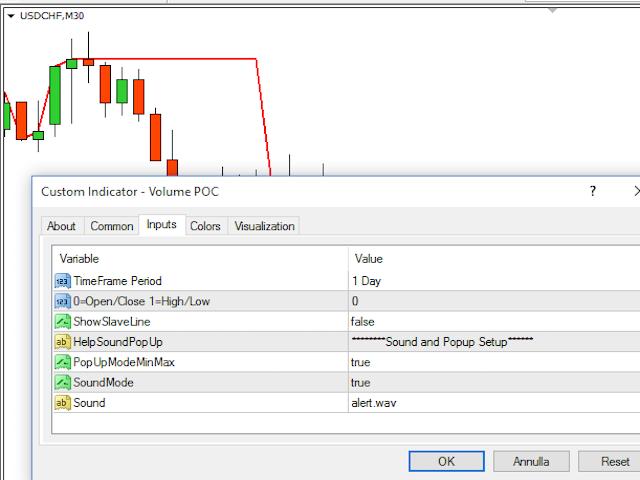
Inputs
- TimeFrame – analyzed period
- 0=Open/Close, 1=High/Low (buffer position)
- Sound and popup setup (ON/OFF, wav)

Thank you for this Volume POC which I find most useful. However I wished there's an option for an outright purchase instead of a maximum rental period of a year.