KT Buy Sell Volume MT4

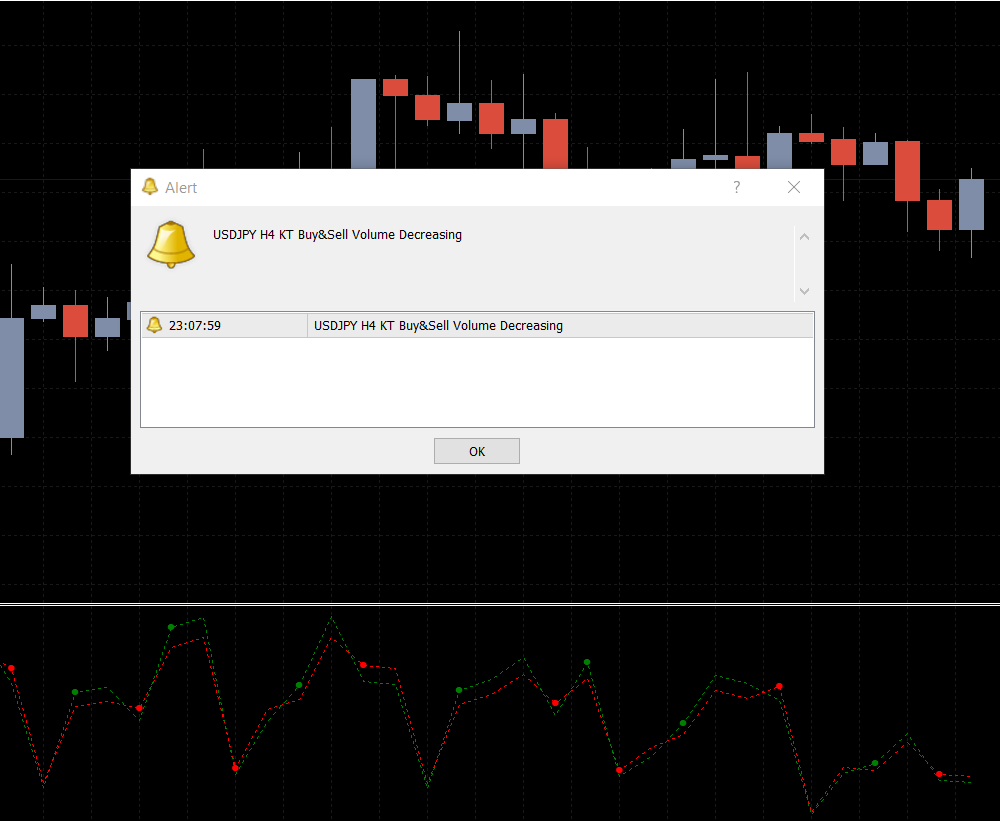
The KT Buy Sell Volume is a powerful tool traders use to gauge the strength and weakness of price movements. In the whirlwind of the Forex market, traders aim to identify and ride the waves of a bullish or bearish trend that exudes strength and potential.

However, recognizing these trends necessitates a method, metric, or indicator to quantify their strength. One crucial factor that traders examine for this purpose is volume. Volume refers to the number of shares or contracts traded in a security or market during a given period. It's the lifeblood of the market, potentially validating a new trend or signaling the end of an existing one.

It provides insights into the force behind breakout and trend-following moves, indicating whether these moves are bullish (buying pressure) or bearish (selling pressure).

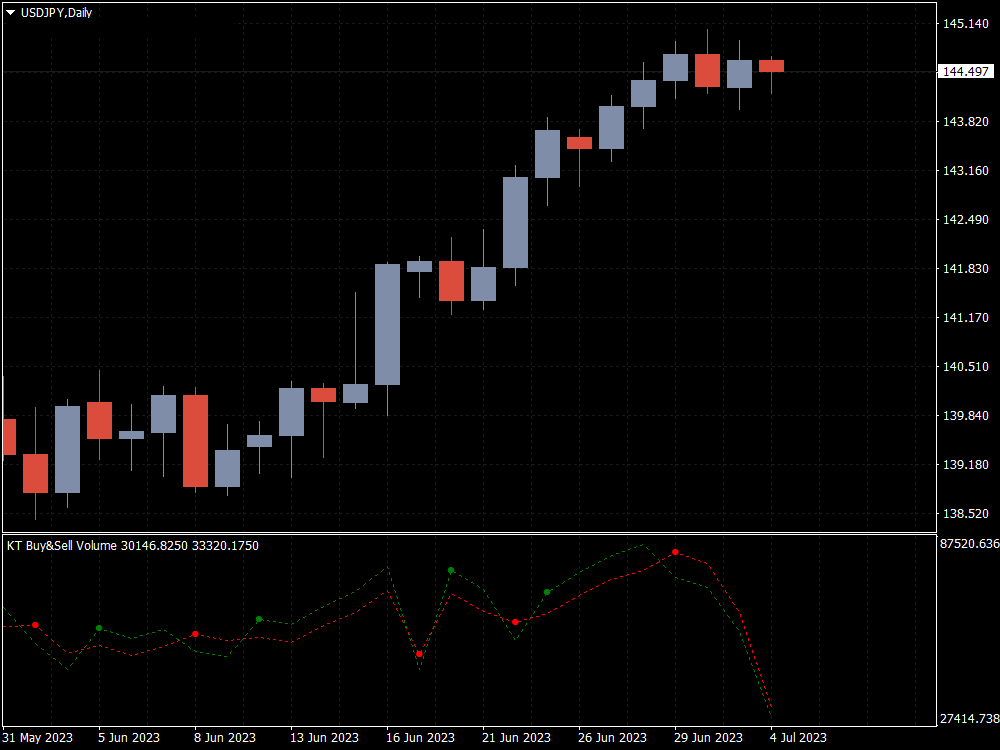
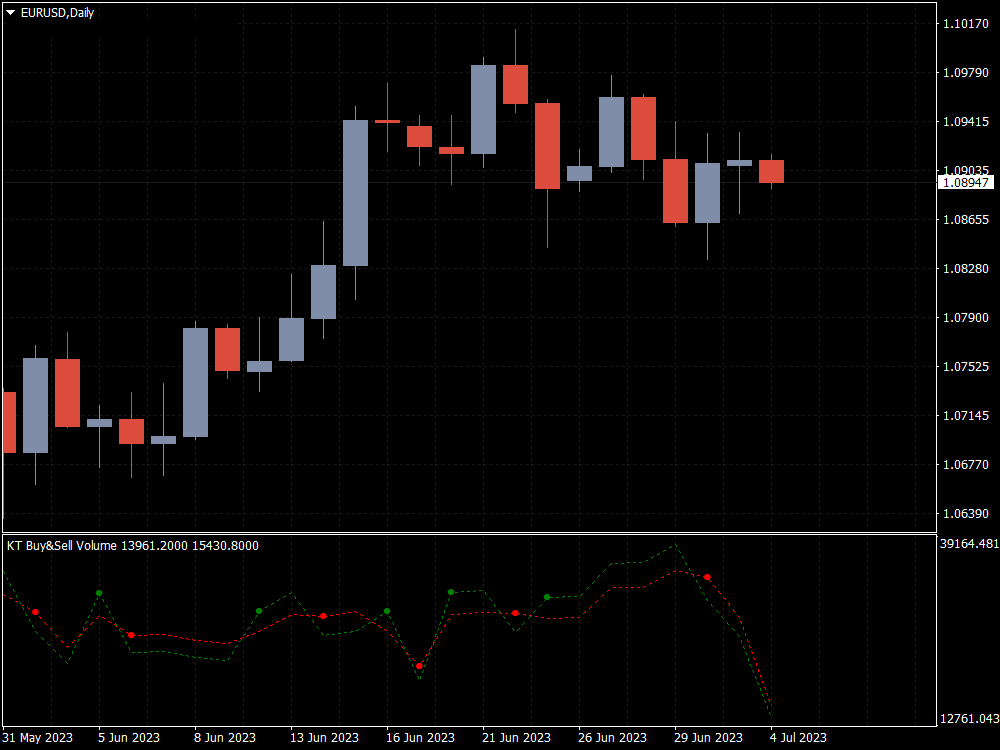
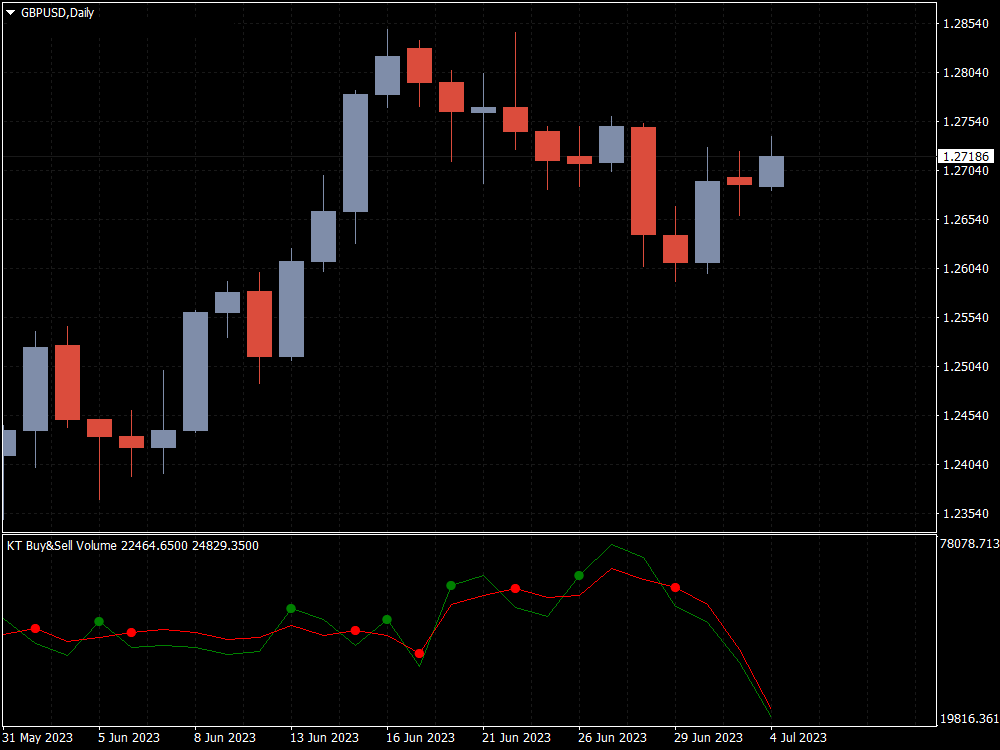
Understanding the Buy/Sell Volume

The indicator uses a dotted curve that undulates to show the fluctuations in market volume. The curve changes color, too, acting as a visual representation of bullish and bearish momentum. When the volume rises, the curve turns green, signaling a potential bullish move.

Conversely, when the trading volume decreases, the curve turns red, implying the market might be setting the stage for a bearish move.

Pro-Tips

  • Conjunction With Price Trends: If the price is rising, but the market volume is decreasing, it might indicate that the upward trend is losing steam, and a price reversal could be imminent.
  • Watch for Divergences: If the price is making higher highs, but the Buy Sell Volume oscillator is making lower highs, it could suggest that the upward trend is not backed by strong volume, and a price reversal might be near.
  • Extreme Volume Spikes: A sudden spike in buying or selling volume could indicate strong market interest and a possible start of a new trend. 
  • Breakout Confirmation: If a price breakout or breakdown occurs on high volume, it usually suggests a real and strong move. 
Prodotti consigliati
Questo indicatore è un indicatore per l'analisi automatica delle onde perfetto per il trading pratico! Caso... Nota:   non sono abituato a usare nomi occidentali per la classificazione delle onde a causa dell'influenza della convenzione di denominazione di Tang Lun (Tang Zhong Shuo Zen), ho chiamato l'onda base come   penna   e la banda dell'onda secondaria come   segmento   At allo stesso tempo, il segmento ha la direzione del trend. La denominazione   è principalmente segmento di trend   (que
Rira VWAP Bands
Vitor Palmeira Abbehusen
VWAP Bands gives you the regular Volume-Weighted Average Price and also the deviation bands. Use this indicator to see the possible amount of market movement, find support and resistance lines, find good spots for entry and exit,  and the most important feature is to find possible pivot points. This indicator has been mathematically improved by Rira team. The calculation begins at the start of each trading day
TMoney OrderblockDay
Moises Orlando Urbina Sojo
The indicator is triggered at the start of each trading day and detects both bullish and bearish ORDERBLOCK potentials. These levels are of high operational probability, being able to use a minimum ratio of 3 to 1 to maximize profits. It is recommended to use TimeFrame M5 to M30 for a proper display and consider pending orders at the OB levels of the chart and place the SL up to a maximum of 20 pips from the entry price. Submit the indicator to Backtesting to become familiar with its performan
Atr Mtf Trend
Jalitha K Johny
The Average True Range (ATR) is a tool to measure volatility. ATR MTF (Multi Time Frame) indicator provides all timeframe trends helps to identify in which kind of volatility environment the market .This indicator can be used with any Trading Systems for additional confirmation of trading entries or exits. It is a very helpful tool to calculate Targets and Stops according the current market conditions.
Cloud Power
Andriy Sydoruk
Implementation of indication of trend movement with moments for potential stops in the Cloud Power indicator. The transition to the shadow warns of a possible reversal. The entry of the price inside the shadow speaks of a flat movement. The indicator tracks the market trend with unmatched reliability, ignoring sharp market fluctuations and noise around the average price. Simple, visual and efficient use. The indicator does not redraw and does not lag. It can be easily used as an independent t
RegLin Polinómico – Bande di regressione polinomiale con filtri intelligenti RegLin Polinómico è un indicatore professionale che adatta un polinomio (grado 1 , 2 o 3 ) a una finestra scorrevole di prezzo e traccia bande dinamiche sulla base della deviazione standard dei residui dell’adattamento. Include RSI (con time frame selezionabile) e un’opzione “solo in trend” per filtrare i breakout di bassa qualità. È inoltre possibile attivare/disattivare l’audio quando vengono generati segnali visivi (
Dublgis
Ivan Simonika
Here is a sensitive indicator for Dublgis professionals. It is built on completely new algorithms and is more efficient, on any timeframes, since it filters random price movements. Finds and visually displays price reversal points. This tool can be used as confirmation when making a deal, as well as to determine the direction of the trend and its strength. The indicator was developed as a complement to a number of our other trading tools.
QuantumAlert Stoch Navigator is a free indicator available for MT4/MT5 platforms, its work is to provide "alerts" when the market is inside "overbought and oversold" regions in the form of "buy or sell" signals. This indicator comes with many customization options mentioned in the parameter section below, user can customise these parameters as needful. Join our   MQL5 group , where we share important news and updates. You are also welcome to join our private channel as well, contact me for the p
FREE
Questo consulente esperto non esegue alcuna operazione, ma esegue la scansione di tutti i simboli nel tuo orologio di mercato e scansiona ciascuna azione una per una in tempi diversi e alla fine ti mostra quale simbolo in quale periodo di tempo ha una potente candela avvolgente. Inoltre, puoi definire un periodo MA e un limite RSI alto e basso, e ti mostra quali simboli in quale intervallo di tempo attraverserà la media mobile regolata e quale simbolo in quale intervallo di tempo attraverserà
FREE
Market Profile
Artem Titarenko
5 (1)
The "Market Profile" indicator displays the profiles and volumes of periods – weekly, daily, session (8-hour), 4-hour, hour, summary. The VAH/VAL price area is automatically highlighted by a dotted line for each profile (except for the summary). The indicator includes chroma Delta, which colors the profile areas. The areas of prevailing Buys is colored in green, that of Sells - in red. The intensity histogram features blue/red respectively. In the filter mode, the indicator displays the volume a
This is a simple arrow system based on Engulfing Candlestick Pattern. It gives you alerts on your smartphone when there is an engulfing candlestick pattern happens. Which type of alerts available? 1. It paints on chart Up/Down Arrows. 2. Popup message and sound alert in trading terminal window. 3. Push notification or Alert on your Android and IOS mobile phones (requires MT4 or MT5 app installed!) *Note: Use it on higher timeframes like H4 (4 hours), D1 (1 Day) then find trade opportunities on s
Hurst Buy and Sell Mt4
Victor Alfonso Molina Botello
Hurst Buy and Sell  This innovative indicator, inspired by xAI Grok intelligence, uses the Hurst exponent to identify the nature of the market and generate buy/sell signals. The EA for this indicator (Hurst Razer PRO EA MT5) is now available, you can see it by clicking here!  https://www.mql5.com/es/market/product/153441?source=Site+Profile+Seller  If you want more signals from the indicator, change the minimum number of bars between consecutive signals. The lower the value, the more signals it
FREE
The Power calculates the strength of the long and short forces by the ratio of the price breakthrough to the average amplitude of the previous market. When the intensity is strong, the signal appears on the chart to estimate the direction of the next wave. There is no future function for the indicator. All signals will not move or disappear after they appear, and have a good real-world reference value. The indicator parameters allow the user to make individual adjustments. More EA and Indicators
MT Scanner
Niravkumar Maganbhai Patel
4 (2)
This indicator helps you to Scan symbols which are in the Market Watch Window  and filter out trends with alerts. It works based on the effective indicator "SUPERTREND" which is used by many traders for trading: When box color changes to " Green " or " Red " color, it indicates you for trend change for long and short entry. And also you will get alerted on screen. When it changes to " Green ", it indicates you that trend is going upwards, and you can take the long entry. If the color changes to
FREE
The indicator allows you to trade binary options. The recommended time frame is М1 and the expiration time is 1 minutes. The indicator suitable for auto and manual trading. A possible signal is specified as a arrows above/under a candle. You should wait until the candle closes! Arrows are not re-painted Trade sessions: London and New York section Currency pairs: AUD/CAD Working time frame: M1 Expiration time: 1 minute The indicator also shows good results when using the martingale strategy - "Ma
FREE
Indicatore Tecnico per la Rilevazione di Forti Pattern di Azione del Prezzo: Pin Bar, Inside Bar e Outside Bar Introduzione: Nel campo dell'analisi tecnica, i pattern di azione del prezzo fungono da indicatori vitali dei potenziali movimenti di mercato. Abbiamo sviluppato un sofisticato indicatore tecnico che semplifica l'individuazione di robusti pattern di azione del prezzo sui grafici. Il nostro indicatore è specializzato nella rilevazione di tre pattern essenziali: il Pin Bar, l'Inside Bar
Un indicatore tecnico che struttura i grafici e identifica i movimenti ciclici dei prezzi. Può funzionare su qualsiasi grafico. Diversi tipi di notifiche. Ci sono altre frecce sul grafico stesso. Senza ridisegnare la storia, lavora sulla chiusura della candela. TF consigliati da M5 in su. Parametri facili da usare e configurare. Se si utilizzano 2 indicatori con parametri diversi, è possibile utilizzarli senza altri indicatori. Ha 2 parametri di input Ciclicità e durata del segnale Questi 2 pa
I  recommend you to read the   product's blog  (manual) from start to end so that it is clear from the beginning what the indicator offers. This multi time frame and multi symbol indicator identifies double top/bottom, head & shoulders, pennant/triangle and flag patterns. It is also possible to setup alerts only when a neckline/triangle/flagpole breakout has occured (neckline breakout = confirmed signal for top/bottoms and head & shoulders).  The indicator can also be used in single chart mode.
REMINDER: Early buyers hot price discount: Price subject to rise after first 20 copies. Starting price $65 and final price will be $1275. Secure your discounted copy Now! Smart Money Analyser Indicator User Manual 1. Introduction Welcome to the   Smart Money Analyser Indicator This powerful tool provides traders with comprehensive market analysis by combining various technical indicators to generate actionable trading signals. Designed to be user-friendly, this indicator helps traders of all
The indicator allows you to trade binary options. The recommended time frame is М1 and the expiration time is 1,2,3 minutes. The indicator suitable for auto and manual trading. A possible signal is specified as a arrows above/under a candle. You should wait until the candle closes! Arrows are not re-painted Trade sessions: TOKYO section (Half-end) Currency pairs: USD/JPY Working time frame: M1 Expiration time: 1,2,3 minutes. The indicator also shows good results when using the martingale strateg
FREE
The Strong Volume Trend  MT4 indicator is a powerful tool designed to help traders identify and capitalize on significant volume trends in the financial markets. With its advanced algorithm, this indicator accurately detects the strength and direction of volume movements, allowing traders to make informed trading decisions. Features: Volume Strength Analysis: The indicator analyzes the volume data and identifies strong volume trends, helping traders spot potential market reversals, breakouts, or
MoveWave
Andriy Sydoruk
MoveWave - Moving waves are very handy indicators for determining pivot levels. Most Forex traders make decisions based on technical analysis. This type of analysis determines patterns and trends in the market. With the help of complex mathematical equations that are combined and made out in the form of this indicator, the trader will be able to more accurately determine the price reversal levels. Wave theory mathematically represents various behavioral models of the market. It is used as the ba
MACD Alerts MT4
KEENBASE SOFTWARE SOLUTIONS
KT MACD Alerts è una versione personalizzata dell’indicatore MACD standard disponibile in MetaTrader. Fornisce avvisi e disegna linee verticali quando si verificano i seguenti due eventi: Quando il MACD incrocia verso l’alto la linea dello zero. Quando il MACD incrocia verso il basso la linea dello zero. Funzionalità Include uno scanner MTF integrato che mostra la direzione del MACD su tutti i timeframe.  Ideale per i trader che operano in base agli incroci del MACD sopra o sotto la linea dello
OVERVIEW The Vector Candle Zones Render indicator automatically renders boxes for vector candle zones that are yet to be recovered. The indicator is an implementation of an existing PVA candles indicator. Combine it with PVSRA and MarketMakerMethod strategy. FEATURES Software: MetaTrader4 - MT4 - 600+ build Timeframes: Multi-Timeframe Markets: Forex/Cryptos/Energies/Bonds/Metals/Indices/Futures/Commodities Customizable style parameters: Change Color style Change Percentage style C
Vi presentiamo l'indicatore Donchian Channels per MQL4, uno strumento potente di analisi tecnica progettato per aumentare il successo delle vostre operazioni. Questo indicatore è composto da quattro linee che rappresentano i limiti superiori e inferiori del movimento dei prezzi in un periodo specificato. Con l'indicatore Donchian Channels potete facilmente individuare potenziali rotture e inversioni di tendenza sul mercato. La linea superiore mostra il massimo più alto del periodo specificato, m
No Repaint Bext
Andrey Kozak
1 (1)
No Repaint Bext is a ready-made trading system. Shows when to open and when to close trades, as well as in which direction. Every time a green arrow appears, you need to open a buy trade. Close all buy trades when a red arrow appears. The same goes for the opposite direction, every time a red arrow appears, open sell trades and close them all when a green arrow appears. We use the M5 timeframe for trading. You can trade on any cozy pair. This indicator does not repaint and practically does not
Range Exhaustion
Robert Gerald Wood
L'esaurimento dell'intervallo si verifica quando il prezzo raggiunge o supera l'intervallo previsto per il periodo corrente. A questi livelli, il prezzo inizia a perdere slancio rispetto all'inizio del periodo, quindi è un buon punto per assicurarsi di non assumere nuove posizioni. Questo indicatore ti mostrerà dove è probabile che ciò accada sul tuo grafico, mostrando i livelli per periodi giornalieri, settimanali e mensili. Quando vedi che il prezzo supera questi livelli di esaurimento, ti sta
The Trend Goblin indicator identifies the mainstream trend. They help to analyze the market on a selected time frame. Easy to set up and works on all pairs and all time frames. Trend indicators provide an opportunity to classify the direction of price movement by determining its strength. Solving this problem helps investors enter the market on time and get good returns. It is extremely important for any trader to correctly determine the direction and strength of the trend movement. Unfortunat
PTW NON REPAINT TRADING SYSTEM + HISTOGRAM Non-Repainting ,   Non-Redrawing   and   Non-Lagging  Trading System. Does the following: - Gives Accurate Entry and Exit Points - Scalping, Day and Swing Trading  - 95% Accuracy  - Targets, where to take profits. - Shows Trends, Support and resistance levels - Works on All Brokers - Works on All Currencies, CFDs and Stocks - It does not place trades for you, it only shows you what trades to place. - It works on All Timeframes - It is for Trend or ran
A useful scanner/dashboard that shows the RSI values for multiple symbols and time-frames. It can be easily hidden/displayed with a simple click on the scanner man top left of the dashboard. You can input upper and lower RSI values and the colours can be set to show when above/below these values. The default values are 70 and 30. There are also input colours for when the RSI is above or below 50 (but not exceeding the upper/lower levels Symbols and time-frames are input separated by commas.
Gli utenti di questo prodotto hanno anche acquistato
Gann Made Easy
Oleg Rodin
4.83 (157)
Gann Made Easy è un sistema di trading Forex professionale e facile da usare che si basa sui migliori principi del trading utilizzando la teoria di mr. WD Gann. L'indicatore fornisce segnali ACQUISTA e VENDI accurati, inclusi i livelli di Stop Loss e Take Profit. Puoi fare trading anche in movimento utilizzando le notifiche PUSH. CONTATTAMI DOPO L'ACQUISTO PER RICEVERE GRATUITAMENTE LE ISTRUZIONI DI TRADING E OTTIMI INDICATORI EXTRA! Probabilmente hai già sentito parlare molte volte dei metodi d
M1 Sniper
Oleg Rodin
5 (19)
M1 SNIPER è un sistema di indicatori di trading facile da usare. Si tratta di un indicatore a freccia progettato per l'intervallo temporale M1. L'indicatore può essere utilizzato come sistema autonomo per lo scalping sull'intervallo temporale M1 e come parte del tuo sistema di trading esistente. Sebbene questo sistema di trading sia stato progettato specificamente per il trading sull'intervallo temporale M1, può comunque essere utilizzato anche con altri intervalli temporali. Inizialmente ho pro
Game Changer Indicator
Vasiliy Strukov
3.77 (26)
Game Changer è un indicatore di tendenza rivoluzionario, progettato per essere utilizzato su qualsiasi strumento finanziario, per trasformare il tuo MetaTrader in un potente analizzatore di trend. Funziona su qualsiasi intervallo temporale e aiuta a identificare i trend, segnala potenziali inversioni, funge da meccanismo di trailing stop e fornisce avvisi in tempo reale per risposte tempestive del mercato. Che tu sia un professionista esperto o un principiante in cerca di un vantaggio, questo st
Dynamic Forex28 Navigator
Bernhard Schweigert
4.43 (7)
Dynamic Forex28 Navigator - Lo strumento di trading Forex di nuova generazione. ATTUALMENTE SCONTATO DEL 49%. Dynamic Forex28 Navigator è l'evoluzione dei nostri indicatori popolari di lunga data, che combinano la potenza di tre in uno: Advanced Currency Strength28 Indicator (695 recensioni) + Advanced Currency IMPULSE con ALERT (520 recensioni) + CS28 Combo Signals (Bonus). Dettagli sull'indicatore https://www.mql5.com/en/blogs/post/758844 Cosa offre l'indicatore di forza di nuova generazione?
Scalper Inside PRO
Alexey Minkov
4.74 (69)
An exclusive indicator that utilizes an innovative algorithm to swiftly and accurately determine the market trend. The indicator automatically calculates opening, closing, and profit levels, providing detailed trading statistics. With these features, you can choose the most appropriate trading instrument for the current market conditions. Additionally, you can easily integrate your own arrow indicators into Scalper Inside Pro to quickly evaluate their statistics and profitability. Scalper Inside
Atomic Analyst
Issam Kassas
5 (3)
Innanzitutto, vale la pena sottolineare che questo indicatore di trading non è repaint, non è ridisegno e non presenta ritardi, il che lo rende ideale sia per il trading manuale che per quello automatico. Manuale utente: impostazioni, input e strategia. L'Analista Atomico è un indicatore di azione del prezzo PA che utilizza la forza e il momentum del prezzo per trovare un miglior vantaggio sul mercato. Dotato di filtri avanzati che aiutano a rimuovere rumori e segnali falsi, e aumentare il pote
GOLD Impulse with Alert
Bernhard Schweigert
4.64 (11)
Questo indicatore è una super combinazione dei nostri 2 prodotti Advanced Currency IMPULSE with ALERT  +   Currency Strength Exotics . Funziona per tutti i time frame e mostra graficamente l'impulso di forza o debolezza per le 8 valute principali più un simbolo! Questo indicatore è specializzato nel mostrare l'accelerazione della forza delle valute per qualsiasi simbolo come oro, coppie esotiche, materie prime, indici o futures. Primo nel suo genere, qualsiasi simbolo può essere aggiunto all
RFI levels PRO
Roman Podpora
5 (1)
L'indicatore mostra accuratamente i punti di inversione e le zone di ritorno dei prezzi in cui il       Principali attori   . Vedi dove si formano le nuove tendenze e prendi decisioni con la massima precisione, mantenendo il controllo su ogni operazione. VERSION MT5     -     Rivela il suo massimo potenziale se combinato con l'indicatore   TREND LINES PRO Cosa mostra l'indicatore: Strutture di inversione e livelli di inversione con attivazione all'inizio di un nuovo trend. Visualizzazione dei l
Scalper Vault
Oleg Rodin
5 (36)
Scalper Vault è un sistema di scalping professionale che ti fornisce tutto il necessario per scalping di successo. Questo indicatore è un sistema di trading completo che può essere utilizzato dai trader di forex e opzioni binarie. L'intervallo di tempo consigliato è M5. Il sistema fornisce segnali di freccia accurati nella direzione della tendenza. Ti fornisce anche i segnali più alti e più bassi e i livelli di mercato di Gann. Gli indicatori forniscono tutti i tipi di avvisi, comprese le notifi
Trend Lines PRO
Roman Podpora
5 (1)
LINEE DI TENDENZA PRO       Aiuta a capire dove il mercato sta realmente cambiando direzione. L'indicatore mostra reali inversioni di tendenza e punti in cui i principali attori rientrano. Vedi  Linee BOS   Cambiamenti di tendenza e livelli chiave su timeframe più ampi, senza impostazioni complesse o rumore inutile. I segnali non vengono ridisegnati e rimangono sul grafico dopo la chiusura della barra. VERSIONE MT 5     -      Svela il suo massimo potenziale se abbinato all'indicatore   RFI LEVE
Supply and Demand Dashboard PRO
Bernhard Schweigert
4.8 (20)
Attualmente 40% di sconto! Questo cruscotto è un software molto potente che lavora su più simboli e fino a 9 timeframe. Si basa sul nostro indicatore principale (migliori recensioni: Advanced Supply Demand ).   Il cruscotto offre un'ottima panoramica. Mostra:    Valori filtrati di domanda e offerta, compresa la valutazione della forza delle zone, distanze dei pip da/all'interno delle zone, Evidenzia le zone annidate, Fornisce 4 tipi di allarmi per i simboli scelti in tutti i (9) time-frames.
Trend Screener
STE S.S.COMPANY
4.79 (95)
Indicatore di tendenza, soluzione unica rivoluzionaria per il trading di tendenze e il filtraggio con tutte le importanti funzionalità di tendenza integrate in un unico strumento! È un indicatore multi-timeframe e multi-valuta al 100% non ridipingibile che può essere utilizzato su tutti i simboli/strumenti: forex, materie prime, criptovalute, indici e azioni. OFFERTA A TEMPO LIMITATO: l'indicatore di screening di supporto e resistenza è disponibile a soli 50$ e a vita. (Prezzo originale 250$) (o
Attualmente 40% di sconto! La soluzione migliore per ogni principiante o trader esperto! Questo software per cruscotti funziona su 28 coppie di valute. Si basa su 2 dei nostri indicatori principali (Advanced Currency Strength 28 e Advanced Currency Impulse). Offre un'ottima panoramica dell'intero mercato Forex. Mostra i valori di forza delle valute avanzate, la velocità di movimento delle valute e i segnali per 28 coppie Forex in tutti i (9) timeframe. Immaginate come migliorerà il vostro tra
Volatility Trend System - un sistema di trading che fornisce segnali per le voci. Il sistema di volatilità fornisce segnali lineari e puntuali nella direzione del trend, nonché segnali per uscirne, senza ridisegnare e ritardi. L'indicatore di tendenza monitora la direzione della tendenza a medio termine, mostra la direzione e il suo cambiamento. L'indicatore di segnale si basa sui cambiamenti della volatilità e mostra gli ingressi nel mercato. L'indicatore è dotato di diversi tipi di avvisi. Pu
El indicador "MR BEAST ALERTAS DE LIQUIDEZ" es una herramienta avanzada diseñada para proporcionar señales y alertas sobre la liquidez del mercado basándose en una serie de indicadores técnicos y análisis de tendencias. Ideal para traders que buscan oportunidades de trading en función de la dinámica de precios y los niveles de volatilidad, este indicador ofrece una visualización clara y detallada en la ventana del gráfico de MetaTrader. Características Principales: Canal ATR Adaptativo: Calcula
Weis Wave with Alert
Trade The Volume Waves Single Member P.C.
4.82 (22)
Rental/Lifetime Package Options and Privileges' Rent Monthly Six Months   Yearly/Lifetime Weis Wave with Speed with Alert+Speed Index x x x Manual  x x x Quick Set up Video x x x Blog x x x Lifetime Updates x x x Setup and Training Material x x Rectangle Break Alert Tool      x Discord Access Channel "The SI traders" x   How to trade info visit:    http://www.tradethevolumewaves.com   ** If you purchase please contact me to setup your  : training Room and  complete manual access.  This is
Apollo Secret Trend è un indicatore di tendenza professionale che può essere utilizzato per trovare le tendenze su qualsiasi coppia e intervallo di tempo. L'indicatore può facilmente diventare il tuo indicatore di trading principale che puoi utilizzare per rilevare le tendenze del mercato, indipendentemente dalla coppia o dal periodo di tempo che preferisci negoziare. Utilizzando un parametro speciale nell'indicatore puoi adattare i segnali al tuo stile di trading personale. L'indicatore fornisc
TPA True Price Action indicator reveals the true price action of the market makers through 100% non-repainting signals (except early signals mode) strictly at the close of a candle! TPA shows entries and re-entries, every time the bulls are definitely stronger than the bears and vice versa. Not to confuse with red/green candles. The shift of power gets confirmed at the earliest stage and is ONE exit strategy of several. There are available now two free parts of the TPA User Guide for our custom
Advanced Supply Demand
Bernhard Schweigert
4.91 (299)
Speciale Trading- SCONTO DEL 40% La soluzione migliore per qualsiasi trader principiante o esperto! Questo indicatore è uno strumento di trading unico, di alta qualità e conveniente, perché abbiamo incorporato una serie di funzionalità proprietarie e una nuova formula. Con questo aggiornamento, potrai visualizzare doppie zone di timeframe. Non solo potrai visualizzare un TF più alto, ma anche entrambi, il TF del grafico e il TF più alto: MOSTRA ZONE ANNIDATE. Tutti i trader che operano con Of
Slayer Binary
Abdulkarim Karazon
5 (1)
Slayer Binary è un indicatore di freccia a una candela con opzioni binarie. Questo indicatore non è per chi cerca il sacro graal, poiché è un approccio poco realistico al trading in generale. L'indicatore fornisce un tasso di successo costante e, se usato con la gestione del denaro e un obiettivo giornaliero, sarà ancora più affidabile. L'indicatore è dotato di molte caratteristiche elencate di seguito: CARATTERISTICHE NESSUNA RIDIPINGENZA: L'indicatore non ridipinge le sue frecce in tempo rea
PRO Renko System
Oleg Rodin
5 (30)
PRO Renko System è un sistema di trading altamente accurato appositamente progettato per il trading di grafici RENKO. Questo è un sistema universale che può essere applicato a vari strumenti di trading. Il sistema neutralizza efficacemente il cosiddetto rumore di mercato che consente di accedere a segnali di inversione accurati. L'indicatore è molto facile da usare e ha un solo parametro responsabile della generazione del segnale. Puoi facilmente adattare lo strumento a qualsiasi strumento di
Currency Strength Wizard è un indicatore molto potente che ti fornisce una soluzione all-in-one per un trading di successo. L'indicatore calcola la potenza di questa o quella coppia forex utilizzando i dati di tutte le valute su più intervalli di tempo. Questi dati sono rappresentati in una forma di indice di valuta facile da usare e linee elettriche di valuta che puoi utilizzare per vedere il potere di questa o quella valuta. Tutto ciò di cui hai bisogno è collegare l'indicatore al grafico che
Top Bottom Tracker è un indicatore basato su sofisticati algoritmi che analizza l'andamento del mercato ed è in grado di rilevare i massimi e i minimi del trend / Versione MT5 . Il prezzo aumenterà progressivamente fino a raggiungere i 500$. Prossimo prezzo --> 99$ Caratteristiche Nessuna riverniciatura Questo indicatore non cambia i suoi valori all'arrivo di nuovi dati Coppie di trading Tutte le coppie forex Timeframe Tutti i timeframe Parametri ==== Configurazione dell'indicatore ====
Currency Strength Exotics
Bernhard Schweigert
4.88 (33)
ATTUALMENTE SCONTATO DEL 20%! La soluzione migliore per qualsiasi principiante o trader esperto! Questo indicatore è specializzato nel mostrare la forza della valuta per qualsiasi simbolo come coppie esotiche, materie prime, indici o futures. È il primo nel suo genere, qualsiasi simbolo può essere aggiunto alla nona riga per mostrare la vera forza della valuta di Oro, Argento, Petrolio, DAX, US30, MXN, TRY, CNH ecc. Si tratta di uno strumento di trading unico, di alta qualità e conveniente pe
Are you looking for a simple and reliable indicator that can help you spot market swing points easily? Do you want clear buy and sell signals that work on any timeframe and any trading instrument? Buy Sell Signal Pro is designed to do exactly that. It helps traders identify important market turning points and understand the current market structure in a clear and easy way. This indicator detects Higher Highs (HH), Higher Lows (HL), Lower Highs (LH), and Lower Lows (LL) so you can quickly see wh
TrendLine PRO MT4
Evgenii Aksenov
4.83 (167)
The Trend Line PRO indicator is an independent trading strategy. It shows the trend change, the entry point to the transaction, as well as automatically calculates three levels of Take Profit and Stop Loss protection. Trend Line PRO is perfect for all Meta Trader symbols: currencies, metals, cryptocurrencies, stocks and indices. The indicator is used in trading on real accounts, which confirms the reliability of the strategy. Robots using   Trend Line PRO   and real Signals can be found here:   
Se acquisti questo indicatore, riceverai il mio Trade Manager Professionale   + EA  GRATUITAMENTE. Innanzitutto è importante sottolineare che questo sistema di trading è un indicatore Non-Repainting, Non-Redrawing e Non-Lagging, il che lo rende ideale sia per il trading manuale che per quello automatico. Corso online, manuale e download di preset. Il "Sistema di Trading Smart Trend MT5" è una soluzione completa pensata sia per i trader principianti che per quelli esperti. Combina oltre 10 indic
Trend indicator AI
Ramil Minniakhmetov
4.49 (84)
Trend Ai indicator è un ottimo strumento che migliorerà l'analisi di mercato di un trader combinando l'identificazione della tendenza con punti di ingresso utilizzabili e avvisi di inversione. Questo indicatore consente agli utenti di navigare nelle complessità del mercato forex con fiducia e precisione Oltre ai segnali primari, l'indicatore Ai di tendenza identifica i punti di ingresso secondari che si presentano durante i pullback o i ritracciamenti, consentendo ai trader di capitalizzare le
FX Power MT4 NG
Daniel Stein
4.95 (21)
FX Power: Analizza la Forza delle Valute per Decisioni di Trading Più Intelligenti Panoramica FX Power è lo strumento essenziale per comprendere la reale forza delle principali valute e dell'oro in qualsiasi condizione di mercato. Identificando le valute forti da comprare e quelle deboli da vendere, FX Power semplifica le decisioni di trading e rivela opportunità ad alta probabilità. Che tu segua le tendenze o anticipi inversioni utilizzando valori estremi di Delta, questo strumento si adatta
Il profitto dalla struttura del mercato cambia quando il prezzo si inverte e si ritira. L'indicatore di avviso di inversione della struttura del mercato identifica quando una tendenza o un movimento di prezzo si sta avvicinando all'esaurimento e pronto a invertire. Ti avvisa dei cambiamenti nella struttura del mercato che in genere si verificano quando stanno per verificarsi un'inversione o un forte pullback. L'indicatore identifica inizialmente i breakout e lo slancio del prezzo, ogni volta c
Altri dall’autore
KT Momentum Arrows MT5
KEENBASE SOFTWARE SOLUTIONS
5 (2)
L'indicatore KT Momentum Arrows si basa su una rottura momentanea calcolata utilizzando la deviazione delle bande e la volatilità emergente in una determinata direzione. Un segnale di acquisto viene generato quando il prezzo chiude al di sopra della banda superiore, mentre un segnale di vendita viene generato quando chiude al di sotto della banda inferiore. Viene utilizzato un coefficiente di magnitudo come input, che influenza sia la deviazione delle bande sia la misurazione della volatilità. I
KT Asian Breakout
KEENBASE SOFTWARE SOLUTIONS
4 (1)
KT Asian Breakout carefully analyzes the range-bound market during the Asian session and then fires a long or short trade after doing some preassessment based on its inbuilt technical analysis module. The executed orders are closed within a day before the completion of the next day session. The inbuilt technical analysis module checks for the session range and compares it with the last 20 days price movement. If it finds any erratic price movement within the session, the orders are not executed
Use of support and resistance in systematic trading is very subjective. Every trader has their own idea and way to plotting the support and resistance levels on the chart. KT Support and Resistance indicator take out this ambiguity out of the situation and automatically draws support and resistance levels following an algorithmic approach using a unique multi-timeframe analysis. When launched on the chart, It immediately scan the most significant extreme points across all the available timefra
ACB Breakout Arrows
KEENBASE SOFTWARE SOLUTIONS
4.15 (34)
L’indicatore ACB Breakout Arrows fornisce un segnale di ingresso cruciale rilevando uno specifico pattern di breakout. Monitora costantemente il grafico alla ricerca di un momentum stabile in una direzione e segnala con precisione l’ingresso poco prima del movimento principale.  Ottieni lo scanner multi-simbolo e multi-timeframe qui - Scanner per ACB Breakout Arrows MT4 Caratteristiche principali Lo Stop Loss e il Take Profit sono calcolati automaticamente dall'indicatore. Include una dashboard
ACB Breakout Arrows MT5
KEENBASE SOFTWARE SOLUTIONS
5 (1)
L’indicatore ACB Breakout Arrows fornisce un segnale di ingresso fondamentale nel mercato rilevando uno specifico pattern di breakout. L’indicatore analizza costantemente il grafico per individuare un momentum stabile in una direzione e fornisce un segnale preciso subito prima del movimento principale. Ottieni lo scanner multi-simbolo e multi-timeframe da qui - Scanner per ACB Breakout Arrows MT5 Caratteristiche principali I livelli di Stop Loss e Take Profit sono forniti automaticamente dall’
KT RSI Divergence Robot MT4
KEENBASE SOFTWARE SOLUTIONS
KT RSI Divergence robot è un Expert Advisor completamente automatizzato che opera le divergenze regolari e nascoste tra il prezzo e l’oscillatore Relative Strength Index (RSI). I segnali di divergenza provengono dal nostro indicatore RSI Divergence disponibile gratuitamente. Non tutte le divergenze sfociano in un’inversione di prezzo di successo; per questo motivo l’EA combina i segnali grezzi di divergenza con il proprio modulo di analisi tecnica integrato per sfruttare l’inefficienza di prez
KT CCI Divergence MT5
KEENBASE SOFTWARE SOLUTIONS
KT CCI Divergence shows the regular and hidden divergence created between the price and CCI oscillator. Divergence is one of the vital signals that depicts the upcoming price reversal in the market. Manually spotting the divergence between price and CCI can be a hectic and ambiguous task. Limitations of KT CCI Divergence   Using the CCI divergence as a standalone entry signal can be risky. Every divergence can't be interpreted as a strong reversal signal. For better results, try to combine it w
ACB Trade Filter MT4
KEENBASE SOFTWARE SOLUTIONS
5 (1)
The ACB Trade Filter indicator provides a solution for filtering out the low probability trading setups in a trading strategy. The indicator uses a sophisticated filtration algorithm based on the market sentiment and trend. Applications Works great with our indicator " ACB Breakout Arrows ". Filter out low probability signals from any indicator. Avoid overtrading and minimize the losses. Trade in the direction of market sentiment and trend. Avoid the choppiness in the market. How to use Only L
KT Momentum Arrows
KEENBASE SOFTWARE SOLUTIONS
L'indicatore KT Momentum Arrows si basa su una rottura momentanea calcolata utilizzando la deviazione delle bande e la volatilità emergente in una determinata direzione. Un segnale di acquisto viene generato quando il prezzo chiude al di sopra della banda superiore, mentre un segnale di vendita viene generato quando chiude al di sotto della banda inferiore. Viene utilizzato un coefficiente di magnitudo come input, che influenza sia la deviazione delle bande sia la misurazione della volatilità. I
KT COG Advanced MT4
KEENBASE SOFTWARE SOLUTIONS
1 (1)
KT COG is an advanced implementation of the center of gravity indicator presented by John F. Ehlers in the May 2002 edition of Technical Analysis of Stocks & Commodities magazine. It's a leading indicator which can be used to identify the potential reversal points with the minimum lag. The COG oscillator catches the price swings quite effectively. MT5 version of the same indicator is available here KT COG Advanced MT5 Calculation of COG The COG indicator is consist of the two lines. The main l
KT Pin Bar
KEENBASE SOFTWARE SOLUTIONS
KT Pin Bar identifies the pin bar formation which is a type of price action pattern which depicts a sign of reversal or rejection of the trend. When combined with support and resistance, BRN and other significant levels, Pin Bar pattern proved to be a very strong sign of reversal. Basically, a pin bar is characterized by a small body relative to the bar length which is closed either in upper or lower 50% part of its length. They have very large wicks and small candle body. A pin bar candlestic
KT Trend Magic
KEENBASE SOFTWARE SOLUTIONS
KT Trend Magic shows the trend depiction on chart using the combination of market momentum and volatility. A smoothing coefficient is used to smooth out the noise from the signal.It can be used to find out the new entries or confirm the trades produced by other EA/Indicators. Usage Drag n drop MTF scanner which scans for the new signals across multiple time-frames. Find new entries in the trend direction. Improve the accuracy of other indicators when used in conjunction. Can be used as a dynami
KT Auto Fibo
KEENBASE SOFTWARE SOLUTIONS
KT Auto Fibo traccia automaticamente i livelli di ritracciamento di Fibonacci basandosi sulla direzione della tendenza in corso. I massimi e i minimi vengono selezionati automaticamente utilizzando i punti massimi e minimi disponibili sul grafico. Puoi ingrandire, ridurre e scorrere il grafico per regolare i livelli di Fibonacci di conseguenza. Modalità Automatico:  Traccia automaticamente i livelli di Fibonacci in base all'area visibile del grafico. Manuale: Traccia i livelli di Fibonacci una
KT Psar Arrows
KEENBASE SOFTWARE SOLUTIONS
KT Psar Arrows traccia frecce sul grafico utilizzando l'indicatore standard Parabolic SAR. Una freccia rialzista viene tracciata quando il massimo della candela tocca il SAR. Una freccia ribassista viene tracciata quando il minimo della candela tocca il SAR. I segnali vengono generati in tempo reale senza attendere la chiusura della candela.  Funzionalità Uno strumento utile per i trader che desiderano sperimentare strategie di trading che includono l'uso dell'indicatore Parabolic SAR.  Può ess
KT Ichimoku Trader
KEENBASE SOFTWARE SOLUTIONS
1 (1)
KT Ichimoku Trader is a fully automated expert advisor that offers five popular trading strategies based on the Ichimoku indicator. Each strategy has it's own entry and exit method without any interference to other strategies. The Ichimoku system can be applied to all major currency pairs and metals. However, we found that it performs reasonably well mainly on two pairs.   MT5 Version is available here  https://www.mql5.com/en/market/product/35043 Features Trade up to 5 famous trading strategi
KT Volatility Oscillator
KEENBASE SOFTWARE SOLUTIONS
L'Oscillatore di Volatilità KT analizza i dati di mercato passati e presenti utilizzando una formula matematica per mostrare il risultato sotto forma di oscillatore. Le onde crescenti e decrescenti corrispondono rispettivamente a un'elevata e a una bassa volatilità dell'asset.  In poche parole, la volatilità è semplicemente una misura delle fluttuazioni di prezzo di un asset in un certo periodo di tempo. Senza volatilità, ci sarebbero pochi movimenti di mercato e i trader non potrebbero trarre p
KT COG Robot
KEENBASE SOFTWARE SOLUTIONS
KT COG Robot is a fully automated Expert Advisor based on the KT COG Indicator . The COG indicator was originally presented by John F. Ehlers in the May 2002 edition of Technical Analysis of Stocks & Commodities magazine. The EA fires a long trade when COG line cross above the signal line and a short trade is fired when the COG line cross below the signal line.  Adaptive Filtration Our adaptive filtration algorithm combines the original COG formula with the major trend direction and market acce
ACB Breakout Arrows EA
KEENBASE SOFTWARE SOLUTIONS
Questo è un Expert Advisor completamente automatizzato basato sul nostro indicatore personalizzato chiamato "ACB Breakout Arrows" . Le entrate si basano su un pattern di breakout che si verifica costantemente in entrambe le direzioni. L’intensità dei segnali può essere regolata tramite il parametro esterno "Signal Sensitivity". Conferma delle operazioni ACB Breakout Arrows EA consente di filtrare gli ingressi utilizzando un altro nostro indicatore personalizzato chiamato ACB Trade Filter . For
KT London Breakout
KEENBASE SOFTWARE SOLUTIONS
First thirty minutes are essential for a trading session. The early reaction of traders and market players sets a path for the rest of the day. KT London Breakout EA takes advantage of this phenomenon, and after analyzing the first thirty minutes of London session, it places two bidirectional pending orders. One of pending order is eventually canceled after realizing the market direction with certainty. It has been strictly tested and developed for EUR/JPY using 30-Min Time Frame. You can expe
Use of support and resistance in systematic trading is very subjective. Every trader has their own idea and way to plotting the support and resistance levels on the chart. KT Support and Resistance indicator take out this ambiguity out of the situation and automatically draws support and resistance levels following an algorithmic approach using a unique multi-timeframe analysis. When launched on the chart, It immediately scan the most significant extreme points across all the available timefra
Se fai trading nel Forex, avere informazioni dettagliate sulla forza delle valute e sulla correlazione tra coppie di valute può portare il tuo trading a un livello superiore. La correlazione ti aiuterà a dimezzare il rischio, mentre l'analisi della forza ti permetterà di massimizzare i profitti. Questo indicatore offre un approccio ibrido per selezionare le coppie di valute più appropriate, combinando l'analisi della forza delle valute e la correlazione tra coppie di valute. Come utilizzare l'a
MACD Divergence Seeker
KEENBASE SOFTWARE SOLUTIONS
KT MACD Divergence Seeker trades the regular and hidden divergence signals generated by our free indicator named KT MACD Divergence indicator. Trading the standalone divergences can be a risky affair that's why the KT MACD Divergence Seeker combines the standard divergence signals with an advanced analysis module to exploit the price inefficiencies on some FX pairs. What is the Divergence exactly? As a general conception if the price is making higher highs, then macd should also be making hig
KT Asian Breakout Indicator
KEENBASE SOFTWARE SOLUTIONS
L'indicatore KT Asian Breakout analizza una parte cruciale della sessione asiatica per generare segnali di acquisto e vendita in entrambe le direzioni, in base alla rottura del prezzo. Un segnale di acquisto si verifica quando il prezzo supera il massimo della sessione, mentre un segnale di vendita si verifica quando il prezzo scende al di sotto del minimo della sessione. Cose da ricordare Se la scatola della sessione è troppo ampia verticalmente, è consigliabile evitare di entrare in nuovi tra
MACD Divergence MT4
KEENBASE SOFTWARE SOLUTIONS
KT MACD Divergence mostra le divergenze regolari e nascoste che si formano tra il prezzo e l’oscillatore. Se la tua strategia di trading prevede un'inversione di tendenza, puoi utilizzare la divergenza regolare del MACD per identificare possibili punti di svolta. Se invece la tua strategia si basa sulla continuazione del trend, la divergenza nascosta del MACD sarà più adatta. Limitazioni di KT MACD Divergence Usare la divergenza del MACD come unico segnale d'ingresso può essere rischioso. Non
KT Bollinger Bands Trader MT4
KEENBASE SOFTWARE SOLUTIONS
KT Bollinger Bands Trader è un Expert Advisor completamente automatizzato che utilizza una strategia di ritorno alla media basata sulle bande di Bollinger durante i periodi di bassa volatilità. Il prezzo spesso reagisce sulla linea superiore o inferiore delle bande, ma non sempre si verifica un'inversione. Tuttavia, la probabilità di un’inversione è maggiore quando la volatilità è bassa. Ingressi Un trade long viene attivato quando il prezzo si posiziona correttamente al di sotto della banda in
KT CCI Divergence MT4
KEENBASE SOFTWARE SOLUTIONS
KT CCI Divergence shows the regular and hidden divergence created between the price and CCI oscillator. Divergence is one of the vital signals that depicts the upcoming price reversal in the market. Manually spotting the divergence between price and CCI can be a hectic and ambiguous task. Limitations of KT CCI Divergence   Using the CCI divergence as a standalone entry signal can be risky. Every divergence can't be interpreted as a strong reversal signal. For better results, try to combine it w
KT Heiken Ashi Smoothed MT4
KEENBASE SOFTWARE SOLUTIONS
KT Heiken Ashi Smoothed è una versione smussata dello Heiken Ashi standard e disegna frecce di acquisto/vendita quando la tendenza cambia. Viene tracciata una freccia di acquisto quando si passa da stato ribassista a rialzista. Viene tracciata una freccia di vendita quando si passa da rialzista a ribassista. Notifiche mobile, email, audio e pop-up incluse. Cosa è esattamente Heiken Ashi Smoothed? Filtra i falsi segnali e il rumore del Heiken Ashi standard applicando due medie mobili per render
KT MA Crossover MT4
KEENBASE SOFTWARE SOLUTIONS
KT MA Crossover disegna frecce di acquisto e vendita in base all'incrocio delle medie mobili selezionate. Inoltre, genera gli avvisi appropriati e visualizza il valore MFE (Escursione Più Favorevole) per ogni segnale consecutivo. L’incrocio delle medie mobili è una delle strategie più utilizzate dai trader di tutto il mondo. Di solito si basa su una media mobile veloce e una lenta per determinare segnali di ingresso in acquisto o vendita in base alla direzione dell’incrocio. Segnale di acquisto
KT Round Numbers MT4
KEENBASE SOFTWARE SOLUTIONS
KT Round Numbers plots the round number levels which are also commonly known as psychological levels in the Forex world. In the context of Forex trading, round number levels are those levels in which there are two or more zeroes at the end. They are named as 00 levels on the chart. Some traders also consider the halfway points as a valid round number level. They are named as 50 levels on the chart. Use of round number levels in trading Round number levels work as strong support and resistance
KT Inside Bar Advanced MT4
KEENBASE SOFTWARE SOLUTIONS
Despite the popularity of inside bar pattern among the traders, using it as a standalone signal doesn't provide any edge in the market. KT Inside Bar Advanced indicator solves this problem by combining the classic inside bar pattern with the "ECE" cycle and Fibonacci extensions. Using this indicator in place of our classic inside bar indicator will provide a tremendous advantage and edge in the market. What is the ECE cycle? In financial markets, the price never moves in a straight line but u
Filtro:
Nessuna recensione
Rispondi alla recensione