KT Momentum Arrows MT5
- Indicatori
-
KEENBASE SOFTWARE SOLUTIONS
 Keenbase Trading sviluppa indicatori professionali ed Expert Advisor per MetaTrader 4 e MetaTrader 5, progettati per aiutare i trader a prendere decisioni di trading più consapevoli.
 - Versione: 3.0
- Aggiornato: 19 luglio 2022
- Attivazioni: 10
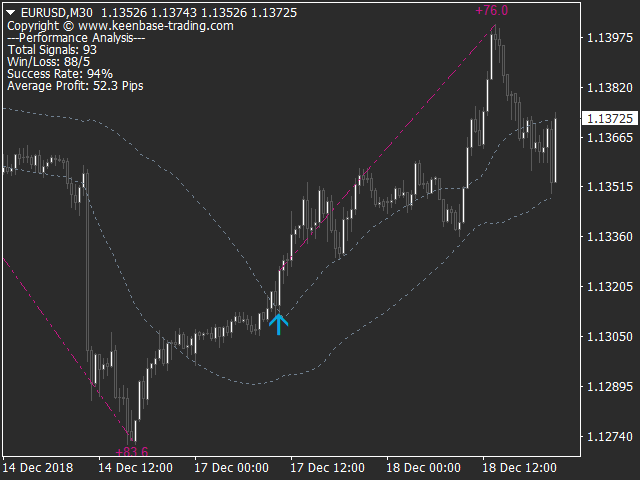
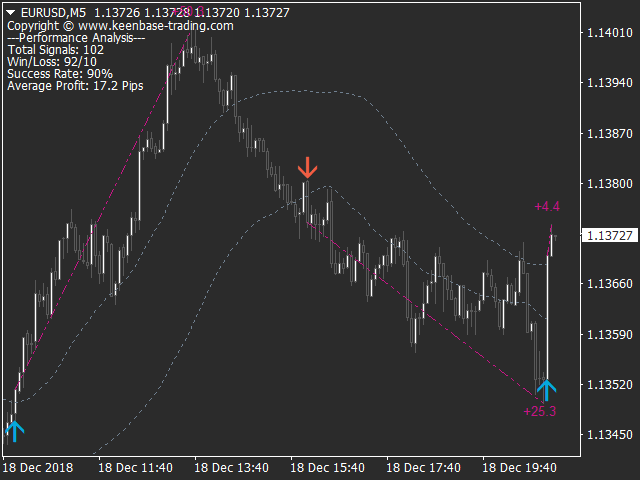
L'indicatore KT Momentum Arrows si basa su una rottura momentanea calcolata utilizzando la deviazione delle bande e la volatilità emergente in una determinata direzione.
Un segnale di acquisto viene generato quando il prezzo chiude al di sopra della banda superiore, mentre un segnale di vendita viene generato quando chiude al di sotto della banda inferiore.
Viene utilizzato un coefficiente di magnitudo come input, che influenza sia la deviazione delle bande sia la misurazione della volatilità. Il valore deve essere scelto con attenzione in base allo strumento e al time frame.
Caratteristiche principali
- Senza repaint!
- Ottimo strumento di ingresso per i trader che operano sul momentum.
- Include analisi delle performance: win/loss, tasso di successo, profitto medio e altro.
- Adatto a Day Trader, Swing Trader e Scalper.
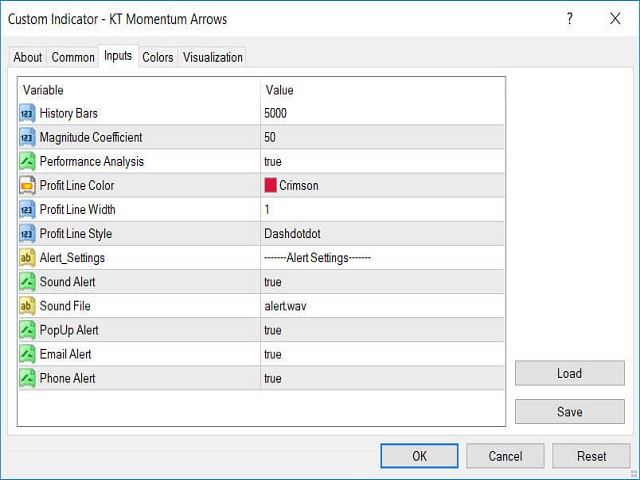
Parametri di input
- Barre storiche: Numero di barre utilizzate per il calcolo dell’indicatore.
- Coefficiente di magnitudo: Un coefficiente per regolare la deviazione delle bande e la volatilità.
- Analisi delle performance: Mostra/nasconde l’analisi, incluse le linee di tendenza del profitto.
- Impostazioni avvisi: Avvisi popup, email, notifiche push e suono disponibili.
- Il resto dei parametri è autoesplicativo.


Best indicator I've ever bought.
Also, the author is very involved.