Regardez les tutoriels vidéo de Market sur YouTube
Comment acheter un robot de trading ou un indicateur
Exécutez votre EA sur
hébergement virtuel
hébergement virtuel
Test un indicateur/robot de trading avant d'acheter
Vous voulez gagner de l'argent sur Market ?
Comment présenter un produit pour qu'il se vende bien
Expert Advisors et indicateurs pour MetaTrader 5 - 53

Gold Smart Turtle – Expert Advisor for XAUUSD (MT5) Recommended Trading Setup Trading Symbol: XAUUSD Broker Type: ECN / RAW / Low-spread brokers (recommended) Timeframe: M5 (fixed) Strategy Type: Rule-based technical trading system Trade Mode: Single-order execution Minimum Deposit: $100 USD (or equivalent) Broker & Account Compatibility Works with all broker quote formats (2-digit / 3-digit) Supports any account base currency Compatible with all XAUUSD symbol variations Independent of broker GM

This Supertrend strategy will allow you to enter a long or short from a supertrend trend change. Both ATR period and ATR multiplier are adjustable. If you check off "Change ATR Calculation Method" it will base the calculation off the S MA and give you slightly different results, which may work better depending on the asset. Be sure to enter slippage and commission into the properties to give you realistic results. If you want automatic trade with Supertrend indicator, please buy following pr
FREE

Koala Trend Line Upgraded To Version 1.2 Last Upgrade Improvement : New Parameter Added that allow user to connect trend line to 2nd or 3th or Xth highest or lowest point.
My Request :
**Dear Customers Please Release Your Review On Koala Trend Line, And Let Me Improve By Your Feed Backs.
Join Koala Trading Solution Channel in mql5 community to find out the latest news about all koala products, join link is below : https://www.mql5.com/en/channels/koalatradingsolution
WHAT ABOUT OTHER FREE
FREE

A tool for on-chart strategy backtesting and performance analysis.
A utility for developing, debugging, and testing custom trading ideas and indicator functions.
An indicator designed to quickly test trading concepts and visualize the effectiveness of different input parameters.
An all-in-one sandbox for testing everything from simple crossovers to complex, multi-condition trading systems.

L'Indicateur de Pression Acheteurs-Vendeurs affiche le sentiment du marché sur plusieurs timeframes de M1 à D1. Il calcule les pourcentages de pression d'achat et de vente en utilisant une analyse de momentum de moyennes mobiles sur une période configurable. Le panneau visuel montre des barres de progression avec la force acheteuse en sarcelle et la dominance vendeuse en rouge, accompagnées de valeurs en pourcentage lorsque significatives. Chaque timeframe inclut une mesure de force de tendance

Async Charts is an indicator to synchronize charts and display a customized crosshair (cursor) on all selected charts. This is a useful utility for traders using multiple timeframes of analyzing multiple symbols for trade entry or exit.
Main Features : Real time Crosshair Synchronization on All Selected Charts
Supports Multiple Timeframes and Multiple Symbols at the same time
Auto Scroll Option
Graphical Adjustment of Color, Font, Size, ...
Locking All or Locking Specific Charts
More and More .
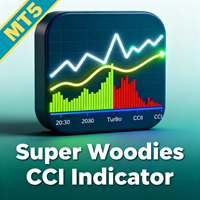
Améliorez votre précision de trading avec l'Ultimate Confluence Signal Indicator MT5, une suite puissante de multi-indicateurs qui synchronise les signaux de plus d'une douzaine d'outils techniques éprouvés pour des setups à haute probabilité en forex, CFD, cryptomonnaies et commodities. Inspiré des principes fondamentaux du trading de confluence —pionniers dans les années 1990 par des experts comme Alexander Elder dans son système "Triple Screen"— cet indicateur a gagné en popularité parmi les

-Concept de tendance de remplissage de mèche
Lors d'événements à forte volatilité sur le marché, les bougies ont tendance à créer des mèches au cours de leurs déplacements. Une mèche dans un chandelier reflète un rejet du prix. La plupart du temps, ces mèches sont remplies parce qu'un énorme volume pousse dans cette direction. Wick Fill Trend scanne ces opportunités en se concentrant sur les marchés de tendance.
Il dispose d'un tableau de bord simulateur de taux de réussite qui affiche le sig
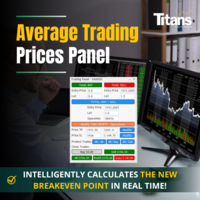
Cherchez-vous un moyen de négocier sur le marché des changes de manière plus efficace et plus rentable ? Nous avons la solution que vous recherchez ! Présentation de notre innovant Entry Price Averages EA, un outil révolutionnaire conçu pour maximiser vos profits et minimiser vos risques. Qu’est-ce qui distingue notre EA de la concurrence ? La réponse est simple : calcul automatique des prix moyens. Imaginez avoir la possibilité de gérer plusieurs transactions ouvertes avec différents lots e

Utilitaire pour copier des transactions d'un compte MT5 ou d'un compte MT4 vers un autre compte MT5. Demo-version can be downloaded here .
Vous pouvez copier des positions entre les comptes netting et Hedging dans n'importe quelle combinaison. Vous pouvez définir des filtres en fonction du nom de l'outil et des numéros de position magiques à copier. Jusqu'à présent, la source envoie des informations uniquement sur les positions du marché. Les ordres en attente sont traités au moment où ils d

SUPER BOT : la solution de trading ultime avec intelligence artificielle pour les indices synthétiques
Êtes-vous prêt à révolutionner votre expérience de trading ? Présentation de SUPER BOT, un conseiller expert avancé conçu pour transformer vos performances commerciales grâce à la puissance de l'intelligence artificielle et à l'adaptation dynamique du marché.
Principales caractéristiques et avantages :
1. Intelligence de marché adaptative : utilisant des algorithmes d'IA avancés, SUPER BOT

If you're a trader looking to use Binance.com and Binance.us exchanges directly from your MetaTrader 5 terminal, you'll want to check out Binance Library MetaTrader 5. This powerful tool allows you to trade all asset classes on both exchanges, including Spot, USD-M and COIN-M futures, and includes all the necessary functions for trading activity. Important: you need to have source code to properly implement the library. With Binance Library MetaTrader 5, you can easily add instruments from Bi

[ MT4 Version ] [ Discord Signals ] MT5 to Telegram Signals
Connect your broker account with Telegram and stop missing important notifications. Would you like to receive Telegram notifications? Are you looking for a simple way to share trade signals with your followers? Do you need to start documenting your trades with an automated trading diary? This utility is simple to use and supports a wide variety of settings: Pick your desired Telegram group and enter the bot token and the chat id G

This non-trading expert utilizes so called custom symbols feature ( available in MQL as well ) to build renko charts based on historical quotes of selected standard symbol and to refresh renko in real-time according to new ticks. Also, it translates real ticks to the renko charts, which allows other EAs and indicators to trade and analyze renko. Place RenkoCharts on a chart of a work instrument. The lesser timeframe of the source chart is, the more precise resulting renko chart is, but the lesse
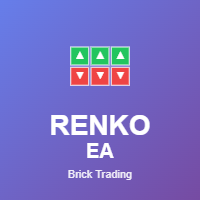
What is Renko EA? The Renko Brick EA is an advanced automated trading system that creates real-time Renko charts directly on your standard MT5 charts. It eliminates time-based noise and focuses purely on price movement, trading only when a specified number of consecutive bricks form in the same direction. Renko Brick Visualization BUY SELL Green Bricks = Bullish Movement | Red Bricks = Bearish Movement Each brick is equal size (no wicks or tails) - Pure price action! Key F
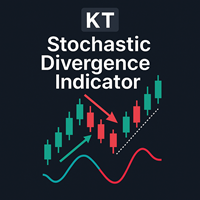
La divergence est l’un des signaux les plus importants permettant d’anticiper un retournement de tendance sur le marché. KT Stoch Divergence détecte les divergences régulières et cachées entre le prix et l’oscillateur stochastique.
Limitations de KT Stoch Divergence
Utiliser les divergences stochastiques comme unique signal d'entrée peut être risqué. Toutes les divergences ne conduisent pas à une forte inversion. Pour de meilleurs résultats, combinez-les avec l'action des prix et la direction d

KT Heiken Ashi Alert trace les flèches d’achat et de vente et génère des alertes en se basant sur les bougies standard Heiken Ashi. C’est un outil incontournable pour les traders souhaitant intégrer Heiken Ashi dans leur stratégie de trading. Une flèche d’achat est affichée lorsque Heiken Ashi passe d’un état baissier à un état haussier. Une flèche de vente est affichée lorsque Heiken Ashi passe d’un état haussier à un état baissier. Inclut des alertes mobiles, par email, sonores et en pop-up.
PAM SCALPER (Price action momentum scalper) analyses historical price data to identify supply and demand zones where liquidity is high and enters with momentum of the institutional money flow. The EA extrapolates areas to either buy or sell from historical price action and volume data. If you want to backtest this EA or any other scalper EA, you must use high quality tick data. The historical data your broker provides through MT5 will give inacurate test results. You can follow my guide how to
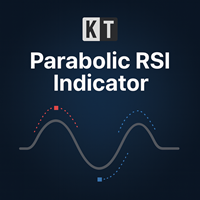
KT Parabolic RSI superpose le Parabolic SAR directement sur la ligne du RSI afin de mettre en évidence les points de retournement probables du marché. Les niveaux classiques de surachat et de survente du RSI indiquent déjà des inversions possibles, mais l’ajout du filtre PSAR élimine une grande partie du bruit et rend les signaux plus clairs et plus fiables, offrant ainsi de meilleures opportunités de trading. Signaux Carré Grand : Un retournement du Parabolic SAR alors que le RSI se situe en zo
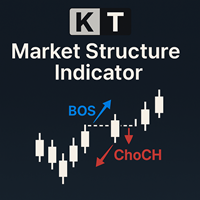
The KT Market Structure intelligently detects and displays Break of Structure (BOS) , Change of Character (CHoCH) , Equal Highs/Lows (EQL) , and various significant swing high/low points using our proprietary algorithm for accurate pattern detection. It also offers advanced pattern analysis by effectively demonstrating the captured profit for each pattern. A fully automated EA based on this indicator is available here: KT Market Structure EA MT5
Features
Accurate Pattern Detection: Our advance
Developed by Smart2Trader
The Didi Index Nuvem Indicator is an indicator based on the original Didi Aguiar (Didi Index) indicator, featuring two visualization methods for the moving averages: as a cloud or as lines (original). This customization offers a new way to visualize the moving average crossovers in the Didi Index indicator. About the Didi Index Indicator The Didi Index Indicator , created by Brazilian trader Didi Aguiar, is a technical analysis tool based on the crossover of three expo
FREE

Keep your MetaTrader 5 charts alive, updated, and always in sync — automatically.
The MT5 Auto Refresh Utility is a smart, zero-lag chart updater designed for traders who want real-time accuracy across every open chart. Whether you use complex dashboards, multi-timeframe systems, or long-running analysis setups, this utility ensures your charts stay active and refreshed without manual clicks or chart reloading. Why You’ll Love It Automatic Chart Refresh
Refreshes your MT5 chart at a fixed int

This EA is a Trade Assistant designed to manage your manually opened trades automatically. It helps you control risk and maximize profits without staring at the screen all day. Perfect for Gold (XAUUSD) scalpers and day traders. Key Features: Auto Initial Stop Loss (ATR): Automatically places a Stop Loss immediately after you open a trade, based on market volatility (ATR). Manual SL Compatible (Hybrid Mode): You can still set your own Stop Loss manually when entering a trade. The EA will respect
FREE

Candle Time (MT5) The Candle Time indicator shows the remaining time for the current candle on the active chart timeframe. It adapts automatically to the chart period and updates on every tick. This is a charting utility; it does not provide trading signals and does not guarantee any profit. Main functions Display the time remaining for the current candle on any timeframe (M1 to MN). Color-coded state: green when price is above the open (up), gray when unchanged, and red when below the open (do
FREE
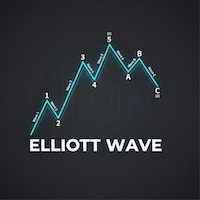
Théorie des Vagues d'Elliott Automatisée 1. Comptage automatique et réduction des biais (Objectivité) Normalement, le comptage des vagues d'Elliott implique beaucoup "d'imagination". Cet indicateur aide en : Trouvant les Vagues d'Impulsion (1-2-3-4-5) : Utilise des règles strictes pour montrer la structure théoriquement correcte. Trouvant les Vagues Correctives (A-B-C) : Aide à repérer les retracements pour entrer dans la tendance. 2. Analyse Multi-Degrés Analyse 3 niveaux de profondeur simultan

Pivot Point Super trend it can be used to catch price turning points and can show arrows for buying and selling. calculations are based on price peaks . you can control the price turning points by increasing the Pivot point period input on the indicator the ATR factor is for how far apart do you want the bands to be spread apart price break outs are also spotted in their early stages which will make trading much better
FREE
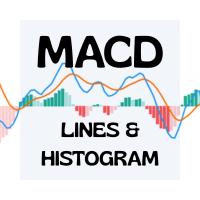
Advanced MACD Indicator with 6 Colors & Adjustable Line Thickness Elevate your trading charts with this fully customizable MACD indicator for MetaTrader 4/5. With six independent color slots and per-line thickness controls, you can tailor every element to your exact preferences. Key Features Six Separate Color Slots
Customize each component with its own color: MACD Line Signal Line Histogram Bars (Bullish) Histogram Bars (Bearish) Zero Line Adjustable Line Thickness
Choose any thickness—from e
FREE

x4o B1 Dollar Trader Heiken Ashi Trend Retest Strategy
Automated trading system combining Heiken Ashi analysis with Moving Average retest methodology for trend-following entries on H1 timeframe. Trading Methodology The EA monitors two 25-period Moving Averages calculated on High and Low prices to identify trend direction. When price closes above MA High with candle high exceeding the moving average, an uptrend is detected. When price closes below MA Low with candle low beneath the moving aver
FREE
Description
Candlestick Pattern Analyzer est un outil avancé pour traders discrétionnaires et systématiques, conçu pour identifier automatiquement les principaux motifs de chandeliers japonais et fournir une analyse statistique détaillée de leurs performances historiques. L’indicateur est idéal pour ceux qui souhaitent vérifier l’efficacité réelle des motifs et les utiliser en combinaison avec des filtres de confirmation (tendance, niveaux clés, volumes, etc.) et une stratégie de gestion des r
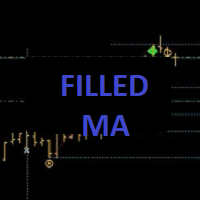
++++++++++++++++++++++++++++++++++ +++ Trend Tool ++++++++++++++++++++++++++++++++++ Hallo Trader, This is a trend tool that I use... based on four moving averages. Price below or above the EMA200 is indication for the long term trend. Also the direction of the slope counts. You can customise in settings if you want. The tool is aligned with my Forecast System and the Bounce Zones. - Forecast System --> https://www.mql5.com/en/market/product/156904 - Bounce Zones --> https://www.mql5.com/en/mar
FREE
Simple Spread Indicator (SSI) is a simple and lightweight indicator that displays the current spread value directly on the main chart window.
It helps traders instantly recognize market liquidity conditions and trading costs without opening additional panels or tools. Features Real-time spread display on the main chart Customizable position and font size Minimal system load and no data buffering Useful for scalping and low-spread strategy monitoring How it works The indicator calculates the diff
FREE

Guardian Equity EA for MetaTrader 5 Guardian Equity EA is an Expert Advisor designed to automatically manage the closure of all open positions when predefined profit or drawdown levels are reached. It operates in real-time and is compatible with any broker or trading instrument supported by MetaTrader 5. Main Features Continuous monitoring of account balance and equity. Automatic closing of all trades if the maximum drawdown level is reached. Automatic closing if the configured profit target is

Zone Alerts by iXOpay - MT5 Indicator What it is Indicator that marks price zones and sends alerts when the price touches, breaks, exits, or retests those zones. Neutral, informative tool. No promises of profit. How to use Attach to any symbol and timeframe. Set the zone boundaries and enable the desired events. Optionally enable trend/volatility filters. Receive alerts and manage your plan. Inputs EMA_Period (20/50/100/200) - optional trend filter Stoch_K , Stoch_D , Stoch_Smooth - confirmation
FREE

The Basket expert advisor can open up to 10 trades at once. It was developed for basket traders who need to open a lot of trades on many different pairs. Expert advisor allows to set a take profit and stop loss as a value in money for each basket trade. This EA is also equipped with hedge functions and allows traders to use the Classic hedge strategy or Sure-Fire strategy, also known as "Always in profit".
Main features Opening multiple trades simultaneously EA Works on any market (forex,

Haven Fibonacci Volume Profiles — Votre Analyste Automatique de Plages de Marché Découvrez Haven Fibonacci Volume Profiles — un outil puissant qui amène l'analyse de marché à un niveau supérieur. Cet indicateur identifie automatiquement les plages de prix clés construites sur des points de pivot significatifs et superpose sur chacune un Profil de Volume détaillé ainsi que des niveaux de Fibonacci. Cela permet aux traders de voir instantanément où la liquidité est concentrée et où se trouvent les

The big figure is a crucial aspect of forex trading, serving as a reference point for trade execution, risk management, and technical analysis. By understanding the importance of the big figure and incorporating it into their trading strategies, forex traders can improve their decision-making process and increase the likelihood of successful trades. Why is the Big Figure Important? The big figure is important for several reasons: Simplification: Traders often refer to the big figure when discu
FREE
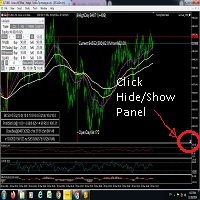
Introducing TEST Lek Trade ONE This EA is developed to meet various usage levels at all levels. Whether you are a new investor or an expert in graphs, various technical analysis, no matter what your trading style is, you can adjust the variable values in this EA to suit your needs. The EA is constantly being developed and updated to be in line with the current situation. This EA has special functions that allow users to design orders for both opening purchase orders, opening sales orders, clo
FREE

Multi-Currency Strength Dashboard PRO MT5 (v2.6) – Currency Strength Meter with Visual Dashboard Multi-Currency Strength Dashboard PRO est un indicateur pour MetaTrader 5 qui mesure en temps réel la force relative des 8 devises majeures (USD, EUR, GBP, JPY, CHF, CAD, AUD, NZD) en analysant jusqu’à 28 paires Forex (selon les symboles disponibles chez votre broker). L’objectif est de fournir une lecture rapide et structurée de la force/faiblesse des devises, afin d’aider à sélectionner des paires

DA 100€/$ A 400.000 IN UN ANNO !!! SI è PROPRIO COSI QUESTO BOT METTE AUTOMATICAMENET L'INTERESSE COMPOSTO. ( SCARICARE IL FILE SET DA INSERIRE NELLE IMPOSTAZIONI ALTRIMENTI IL BACK TEST NON FA GLI STESSI PROFITTI, LO TROVATE SOTTO I COMMENTI )
G-load Pro. MARCHIO REGISTRATO è L'UNICO ORIGINALE I TEST SONO STATI FATTI SU XMGLOBAL ( NO ECN) ( SCARICARE IL FILE SET DA INSERIRE NELLE IMPOSTAZIONI ALTRIMENTI IL BACK TEST NON FA GLI STESSI PROFITTI, LO TROVATE SOTTO I COMMENTI )
TIME FRAME h1
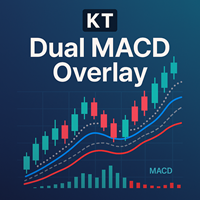
KT Dual MACD Overlay trace deux MACD complets directement sur votre graphique : l’un basé sur l’unité de temps actuelle, l’autre sur une unité supérieure. Le MACD rapide détecte l’élan à court terme, tandis que le MACD lent vous garde en phase avec la tendance générale. Superposés aux chandeliers, ils offrent une lecture intégrale du momentum sans changer de fenêtre ou de graphique.
Achats
Entrée principale : Une ligne verticale bleue apparaît au début d’une tendance haussière. Renforts : Décle
The Price Action Builder Basic expert advisor was created with the primary goal of providing a free, configurable, easy to use, decently profitable automated trading strategy. At the same time, an equally important goal is ensuring a low drawdown and avoiding exposure to high risks through:
usage of automatically placed stop loss orders for all launched trades; allowing maximum 1 managed open trade at a given time, avoiding pressure on margin/deposit load; minimization of positions holding tim
FREE
Il s'agit du script nécessaire pour utiliser The News Filter. Ce script sélectionne n'importe quel graphique que vous souhaitez filtrer et envoie les données au programme The News Filter. Chaque entrée est spécifique à ce graphique, ce qui vous permet de définir des entrées différentes pour chaque graphique. Les liens vers The News Filter (démo gratuite) se trouvent ci-dessous : Le guide du filtre d'actualité + liens de téléchargement
Sélection de nouvelles
La source d'informations est obtenue
FREE

INTRODUCTION Maximize Your Trading Potential Gold Miner Pro is an automated trading tool designed for the gold market (XAUUSD). It applies a precise scalping strategy powered by mathematical models and statistical analysis to detect favorable market setups. Specializing in gold trading, Gold Miner Pro works for you 24/7, minimizing risk and maximizing trading performance. Let Gold Miner Pro be your trusted companion in your gold investment journey!
RECOMMENDATIONS - Account Type: Use a Cent Acc

INTRODUCTION Gold Rush Turbo – Ride the Fastest Wave of Gold Trading Experience the thrill of fast-paced gold trading. Gold Rush Turbo is a high-performance, medium-risk Expert Advisor designed for traders who thrive in dynamic market conditions. Built for aggressive scalping on XAUUSD (gold), it uses rapid market entries, tight stops, and momentum-based logic to capture short-term price movements. If you’re ready for high-speed decision-making, Gold Rush Turbo keeps your strategy sharp and your

It is a system with many options to help each user find their own settings. There are possibilities to use a filter based on two averages, as well as the choice of whether the system will work at certain hours of the market. The default settings are tested for the eurusd pair. I would recommend that each user do their own testing and find settings that suit their preferences. This is not a ready-made system that you will use without working on it. But it is a good tool to build each user a strat
FREE

This MT5 expert adviser is based on price action trading , which is a method of technical trading that relies on observing price movements and patterns. It can capture trend phases as well as be used as a scalping tool. The settings allow both options. You can also adjust the take profit and stop loss levels dynamically according to the market conditions by using the average daily range (ADR) . However, you should always do your own backtests with your data and understand that profits are not g

Ritz Conspiracy 16 – Multi-Layer Market Intelligence System Ritz Conspiracy 16 adalah indikator analisis pasar multi-layer yang menggabungkan 16 indikator teknikal utama ke dalam satu panel visual terpadu.
Dirancang dengan konsep market intelligence , indikator ini bekerja seperti pusat komando yang membaca perilaku pasar dari berbagai sudut: trend, volatilitas, momentum, volume, hingga struktur harga. Dengan pendekatan “konspiratif”, indikator ini menghubungkan jejak kecil dari 16 algoritma unt
FREE

RiskRewardPanel – Outil de calcul Risque/Rendement pour MetaTrader 5 RiskRewardPanel est un outil pratique conçu pour aider les traders à calculer le risque et le rendement potentiel avant l’ouverture d’une position. Il permet de déterminer automatiquement la taille de lot, les niveaux de stop loss et de take profit en fonction des paramètres de risque définis par l’utilisateur, avec une visualisation directe sur le graphique. Fonctionnalités principales : Calcul du risque et du profit potentie
FREE

Panneau Phoenix Spread (MT5)
Panneau de surveillance des spreads en temps réel pour MetaTrader 5. Affiche le spread acheteur/vendeur actuel en points sur votre graphique.
Objectif
L'élargissement des spreads est l'une des causes les plus négligées des pertes de trading. En période de faible liquidité, de rollovers, d'événements d'actualité ou de conditions volatiles, les spreads peuvent s'élargir considérablement, transformant des transactions autrement valables en pertes instantanées.
Le pa
FREE

Découvrez mrKrabsGold – Kelly MultiTP , votre nouvel EA de scalping ultra-perfectionné, conçu pour maximiser vos gains tout en maîtrisant les risques : Principales caractéristiques : Stratégie scalping & hedging : détecte et exploite les retournements rapides de tendance, avec couverture automatique pour limiter les pertes. Sizing dynamique selon Kelly : allouez la taille de position optimale en fonction de vos performances passées grâce au facteur de Kelly ajustable. Multi-Take
FREE
The Channel Sgnals ProfRoboTrading Indicator for MT5 is an effective Forex trading tool designed to track market movements. The MT5 signal point indicator effectively detects trend reversals after they have already occurred. This Indicator is a fully automated technical tool that includes a number of parameters to track market trends. It automatically examines the ever-changing price dynamics of the market, compares the information with earlier data and generates a trading signal. Because
FREE

GoldMacher – Session-Aware XAUUSD EA Start from $50 – Low Leverage 1:20 or 1:10 – Fixed Lot – No Martingale Contact me for the manual for back testing pls LAST COPY available at $90 MT4 Version available here Trade gold with structure, timing, and discipline.
GoldMacher is built for traders who want clarity, not complexity. It focuses on the sessions and market conditions where XAUUSD tends to behave in repeatable ways — and it stays quiet when conditions are poor. Why GoldMacher? Session int

Thermo MAP is a multicurrency and multitimeframe indicator that display a smart heat map based on proprietary calculations. Watch how Forex market moved and is currently moving with a single dashboard and have a consistent and good idea of what is happening!
It can be suitable for both scalping or medium/long term, just select options that better fit your trading style Symbols list are automatically sorted based on the preferred column. There is the possibility to click on: First row, timeframe
FREE

Gardien RSI Dynamique – Trading de Précision avec Gestion Complète des Risques Le Gardien RSI Dynamique est un système de trading algorithmique professionnel conçu pour les traders qui privilégient une performance constante, un contrôle strict des risques et une flexibilité. Basé sur des calculs avancés en pips et des filtres intelligents pilotés par le RSI, il garantit que chaque trade respecte des règles strictes pour minimiser les risques tout en maximisant les opportunités. Caractéristiqu
FREE

Cycle Sniper MT5 Cycle Sniper MT4 Version and definitions : https://www.mql5.com/en/market/product/51950 Important Notes: MT5 Version does not include Breakout Mode and Late Entry Mode Features.
MT5 Version does not include RSI and MFI filter. **Please contact us after your purchase and we will send you the complimentary indicators to complete the system.**
This indicator does not send any signal without a reason...You can observe and analyze the indicator and the signals it sends Cycle Sni

Cet indicateur combine les indicateurs classiques MACD et Zigzag pour détecter la divergence entre le prix et les indicateurs. Il utilise également une technologie avancée d’intelligence artificielle (IA) pour détecter la validité des divergences.
MACD est connu comme le « roi des indicateurs » et Zigzag est également un indicateur très utile. En combinant ces deux indicateurs, cet indicateur exploite les atouts des deux.
La détection de divergence est un problème probabiliste. Souvent, les d

SqueezeMAX Pro – Mikko Breakout Indicator
Détecteur professionnel de cassures (breakouts) pour MetaTrader 5, conçu pour identifier des opportunités de marché claires, fiables et sans repaint, avec des performances élevées. OFFRE SPÉCIALE :
Jusqu’au 05/01/2026 , cet indicateur sera gratuit ou limité aux 100 premiers téléchargements (selon la première éventualité). Profitez-en tant que cette opportunité est disponible. SqueezeMAX Pro – Mikko Breakout Indicator Le SqueezeMAX Pro est un indicateur
FREE

Maximize your profits and protect your capital on any symbol, any broker, any digits. Demonstration video: https://youtube.com/shorts/enSPf2qCsVU?si=1LBVjmVzgFJE751C The Universal Trailing Stop and Breakeven EA is a powerful, beginner-friendly tool that automates trailing stop management across all your open trades. Whether you are scalping XAUUSD, swinging BTCUSD, or day trading EURUSD, this expert advisor ensures you are always locking in gains while minimizing risk.
What's New in 2.0? Perce
FREE

Description This is a Utility tool for MT5 which will make our chart analysis task quite more efficient and save large amount of time. As for chart analysis, some are watching out several symbol simultaneously with single timeframe and others are trading only one single pair with multi timeframe analysis. For both, a common troublesome issue is “scroll chart to look back” or “draw chart objects” in multi charts at the same time. Especially for those who are trading with multi timeframe soluti

MT4 version Overview The Lowess Channel indicator is a smoothed trend-following tool designed to help traders identify the direction of the trend , detect flat or ranging markets , and spot breakouts from consolidation zones. It creates a central smoothed line with upper and lower channel boundaries, adapting to market noise while maintaining clarity. How It Works The indicator builds a channel around a smoothed price line. The central line reflects the current trend. The upper and lower bounda
FREE
1. Introduction The Squeeze Momentum Plus is a powerful technical analysis tool designed to help traders identify periods of low market volatility (the "squeeze" phase) and assess the direction and strength of price momentum . This indicator combines the principles of Bollinger Bands and Keltner Channels to detect changes in market volatility, along with a momentum oscillator to measure buying/selling pressure. 2. Key Components of the Indicator The Squeeze Momentum Plus is displayed in a separa
FREE

Multitimeframe Viewer HiddenEdge – HTF Realtime MiniChart A clear view of higher-timeframe structure — directly inside your main chart.
No need to switch timeframes anymore. HiddenEdge Multitimeframe Viewer shows the last candles of any higher timeframe in a compact, real-time panel — so you can see the bigger picture while staying focused on execution. Key Features Realtime update: the current higher-timeframe candle is drawn live, updating every second. Select how many candles to display:
FREE

Read This : Please provide comments and reviews for future improvements. WaveTrendPro_Indi v1.05
WaveTrend indicator with enhanced histogram visualization: WaveTrendPro_Indi v1.05
Indikator WaveTrend dengan tampilan histogram yang lebih jelas: Histogram otomatis lebih tinggi (bisa diatur dengan parameter HistScale ). Warna histogram berbeda untuk positif & negatif → tren naik lebih mudah dibaca. Tetap ringan & responsif di berbagai pair/timeframe. Cocok untuk scalper, swing trader,
FREE

My Fibonacci MT5 An automated Fibonacci indicator for MetaTrader 5 that combines ZigZag swing detection with comprehensive Expert Advisor integration through a 20-buffer system. More details about data specification and EA integration: https://www.mql5.com/en/blogs/post/764114 Core Features Automated Fibonacci Detection The indicator identifies swing points using configurable ZigZag parameters and draws Fibonacci retracements and extensions automatically. It updates levels as new swing formatio
FREE

This indicator draws regular bullish and bearish divergences in real-time onto the charts. The algorithm to detect those divergences is based on my 10+ years experience of detecting divergences visually. The divergences are drawn as green and red rectangles on the charts. You can even do forward testing in the visual mode of the strategy tester. This FREE Version is restricted to EURUSD and GBPUSD. The full version without restrictions is here: https://www.mql5.com/en/market/product/42758
Para
FREE

My Money Manager like a risk controller, which places your trades with the exact volume that meets your desired stop loss risk percentage. It can also help you to preview your EP/SL/TP levels before placing an order by dragging these levels directly on a chart, and keep reporting about them during the position opening. With this tool, you will feel more comfortable when deciding to open orders, as well as forecasting your profit/loss with your orders. Placing orders is a very precise and profess

Clock GMT Live a tout ce dont vous avez besoin pour en savoir plus sur notre courtier, plusieurs fois vous vous serez demandé sur quel gmt je suis ou sur quel gmt mon courtier travaille, eh bien avec cet outil vous pourrez savoir en temps réel à la fois le GMT décalage horaire du broker et de votre heure locale, vous connaîtrez également en permanence le ping du broker Juste en le plaçant à un moment de la journée, vous pouvez obtenir les informations
Le prix augmente pour chaque acquisition,
FREE

2025 Spike Killer Dashboard - Advanced Trading Signals & Market Analytics Transform Your Trading with Intelligent Market Insights! The 2025 Spike Killer Dashboard is a powerful MQL5 indicator that combines cutting-edge signal generation with an intuitive crystal dashboard for real-time market analysis. Designed for traders who demand precision and clarity, this all-in-one tool delivers actionable signals and comprehensive market metrics at a glance. Key Features: Dual Signal System Shved S

Crosshair est un outil fantastique qui simplifie notre analyse graphique en alignant parfaitement les bougies de prix avec les valeurs des indicateurs dans les sous-fenêtres.
Vous pouvez l'activer et le désactiver par une simple pression sur la touche "C" de votre clavier, et il offre un mode règle pour des mesures précises qui peut être activé et désactivé par la touche "R" de votre clavier.
Veuillez regarder notre court tutoriel vidéo intégré ci-dessous pour voir comment il fonctionne.

Certainly! Let me introduce you to a powerful tool for MetaTrader 5 (MT5) that can automatically identify and draw support and resistance (S&R) levels on your trading charts. This tool is called the “Support and Resistance Levels Guru” . Support Resistance Levels Guru The Support & Resistance Indicator automatically displays essential S&R levels on your chart. These levels are crucial for technical analysis and are used by many traders. Resistance levels (zones) are shown in R ed , while suppo
FREE
Le MetaTrader Market est un site simple et pratique où les développeurs peuvent vendre leurs applications de trading.
Nous vous aiderons à publier votre produit et vous expliquerons comment préparer la description de votre produit pour le marché. Toutes les applications de Market sont protégées par un cryptage et ne peuvent être exécutées que sur l'ordinateur de l'acheteur. La copie illégale est impossible.
Vous manquez des opportunités de trading :
- Applications de trading gratuites
- Plus de 8 000 signaux à copier
- Actualités économiques pour explorer les marchés financiers
Inscription
Se connecter
Si vous n'avez pas de compte, veuillez vous inscrire
Autorisez l'utilisation de cookies pour vous connecter au site Web MQL5.com.
Veuillez activer les paramètres nécessaires dans votre navigateur, sinon vous ne pourrez pas vous connecter.