Voir comment télécharger gratuitement des robots de trading
Retrouvez-nous sur Telegram !
Rejoignez notre page de fans
Rejoignez notre page de fans
Vous avez aimé le script ? Essayez-le dans le terminal MetaTrader 5
- Publié par:
- Biantoro Kunarto
- Vues:
- 65
- Note:
- Publié:
-
Besoin d'un robot ou d'un indicateur basé sur ce code ? Commandez-le sur Freelance Aller sur Freelance
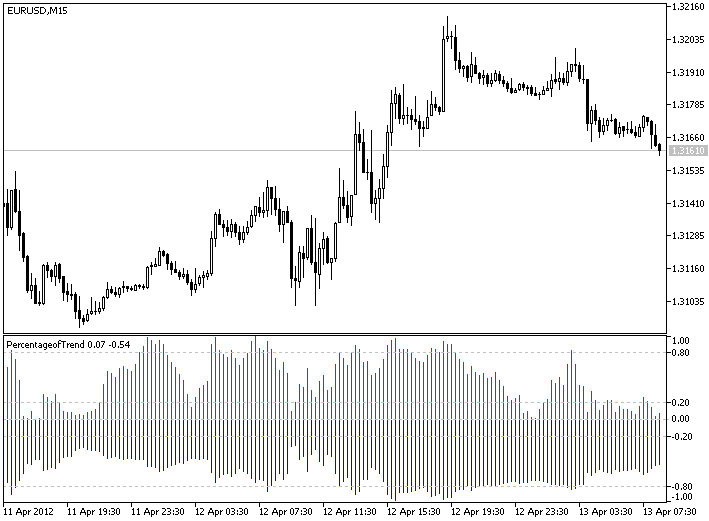
Les valeurs de l'indicateur sont calculées par la formule suivante :
- Pour la première période (couleur rouge) = (Close - LowValue) / (HighValue - LowValue)
La valeur est comprise entre 0 et 1.
La valeur la plus élevée signifie une tendance haussière, la valeur la plus basse signifie une tendance baissière, la valeur au milieu signifie une tendance latérale.
- Pour la deuxième période (couleur bleue) = (Close - LowValue)*-1 / (HighValue - LowValue)
La valeur est comprise entre -1 et 0.
La valeur la plus élevée signifie une tendance baissière, la valeur la plus basse signifie une tendance haussière, la valeur au milieu signifie un mouvement latéral.
où :
- HighValue - le plus haut pour la période n ;
- LowValue - la valeur la plus basse pour n période ;
Paramètres d'entrée :
- InpPeriod1 - Première période pour le calcul de la tendance ;
- InpPeriod2 - Deuxième période pour le calcul de la tendance ;

Traduit de l’anglais par MetaQuotes Ltd.
Code original : https://www.mql5.com/en/code/868
 Objects Description Activator
Active la "Description des objets graphiques" pour les non-programmeurs. Pour toute fenêtre graphique ouverte.
 Class For Working With Databases In A Simplified Manner
easydatabase
 ColorChart
Script simple pour randomiser toutes les couleurs de votre graphique. Cliquez simplement dessus et voyez les résultats par vous-même !
 AIS Extremum
L'indicateur permet d'estimer la probabilité que le prix ait atteint son maximum ou son minimum.