Average True Ticks MT4
- Indicadores
- Versión: 4.23
- Actualizado: 26 marzo 2020
- Activaciones: 5

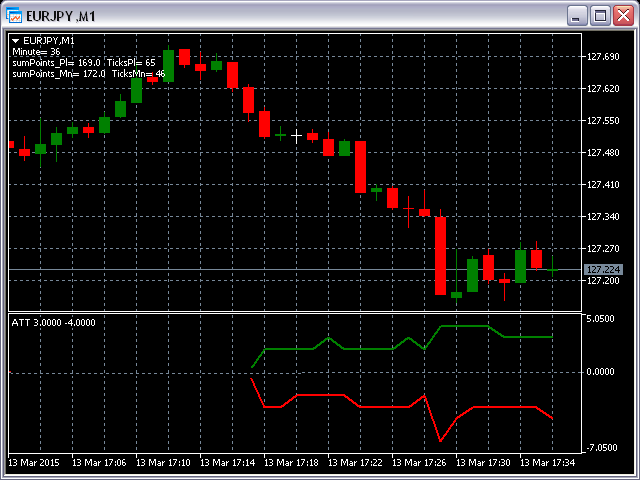
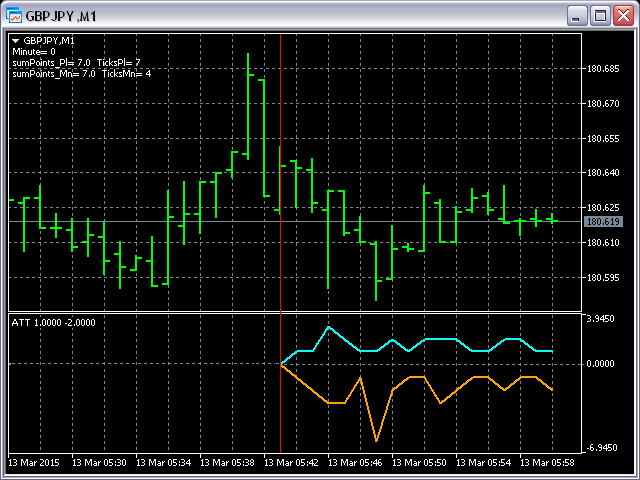
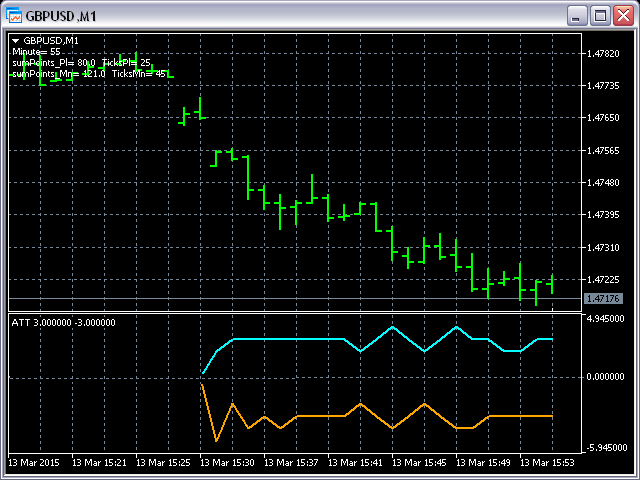
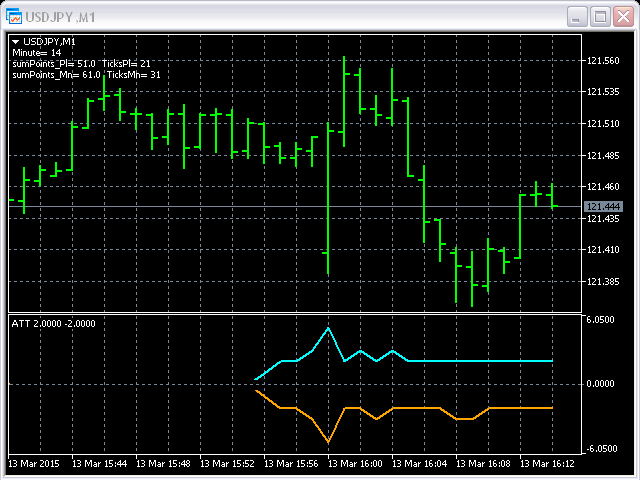
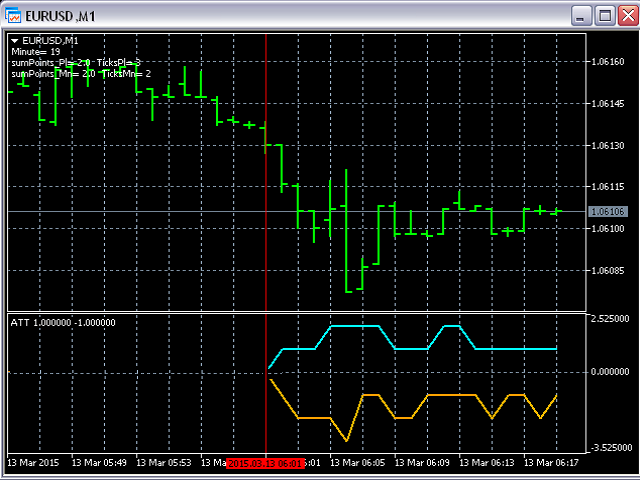
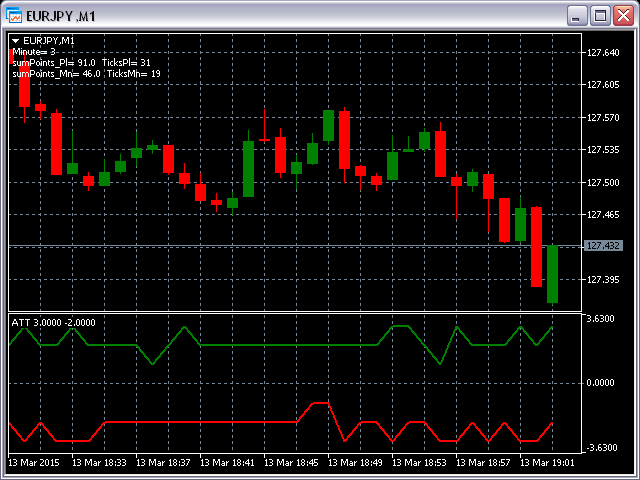
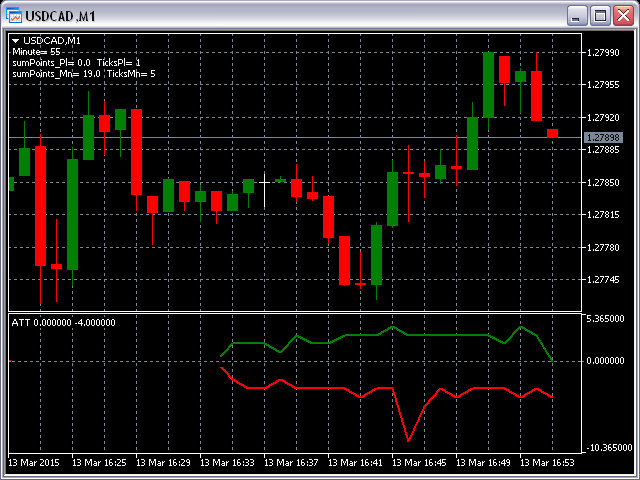
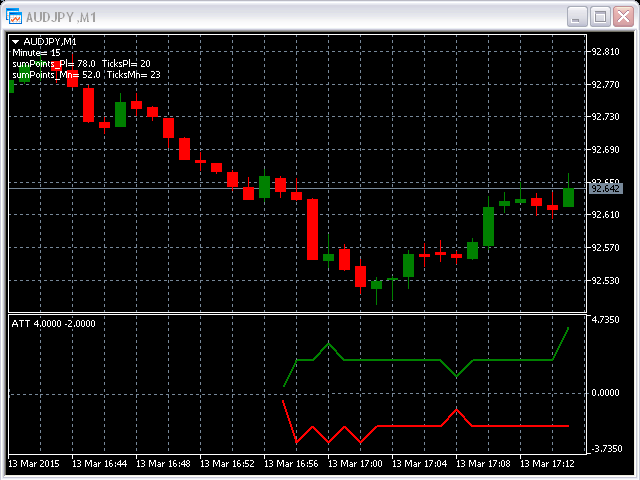
Este indicador está diseñado para el marco de tiempo M1 y muestra 2 líneas:
- Suma de Puntos cuando el precio sube dividido en Suma de Ticks cuando el precio sube (color Aqua).
- Suma de Puntos cuando el precio baja dividido en Suma de Ticks cuando el precio baja (color Naranja).
Verá todos los datos principales como un comentario en la esquina superior izquierda del gráfico.
Tenga en cuenta que la Suma de Puntos será mayor o igual a la Suma de Ticks.
Por supuesto, el ATT está calculando todos los ticks hacia adelante solamente, comenzando desde el momento en que usted puso este indicador en el gráfico.