Average True Ticks MT4
- Indikatoren
- Version: 4.23
- Aktualisiert: 26 März 2020
- Aktivierungen: 5

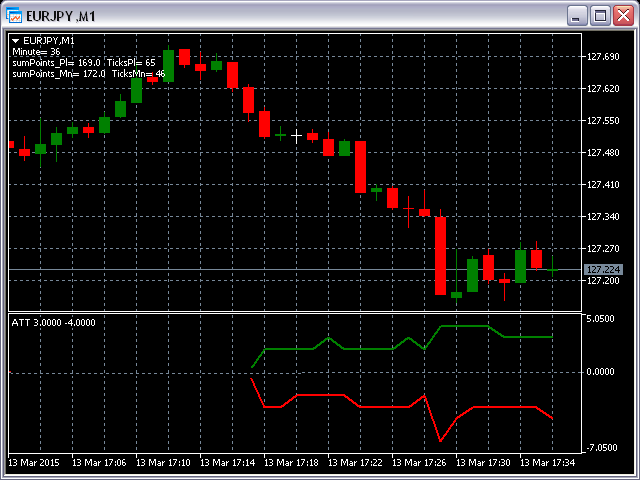
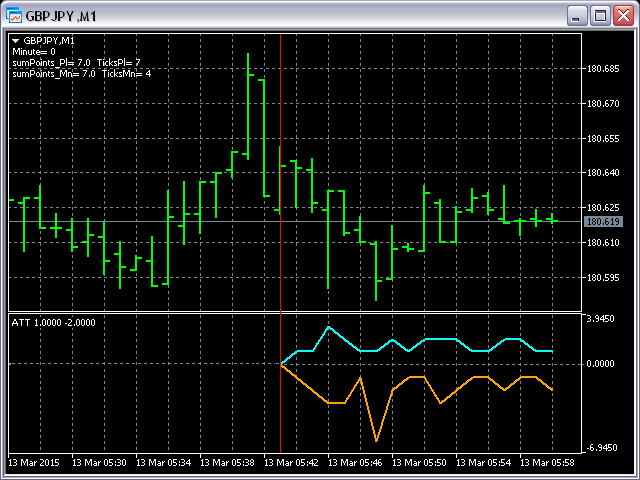
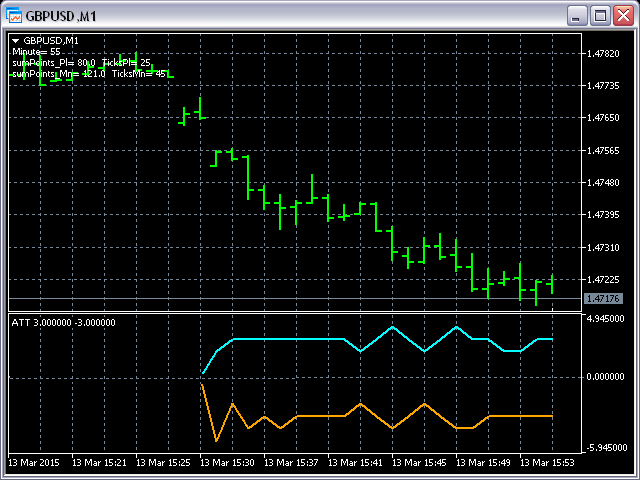
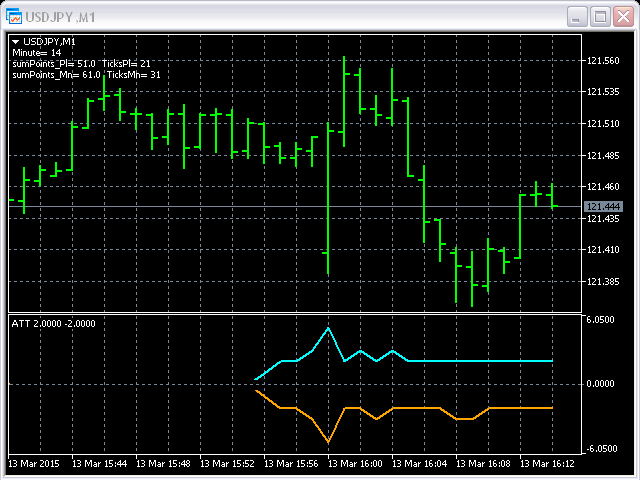
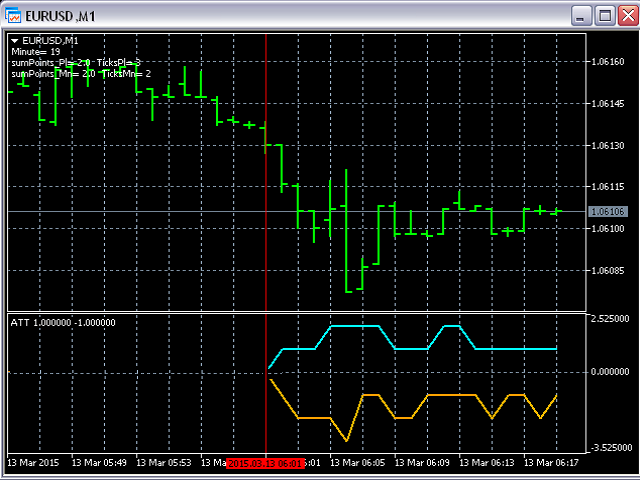
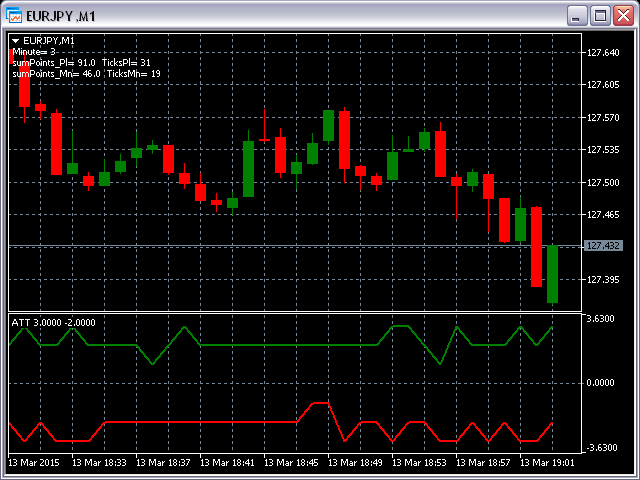
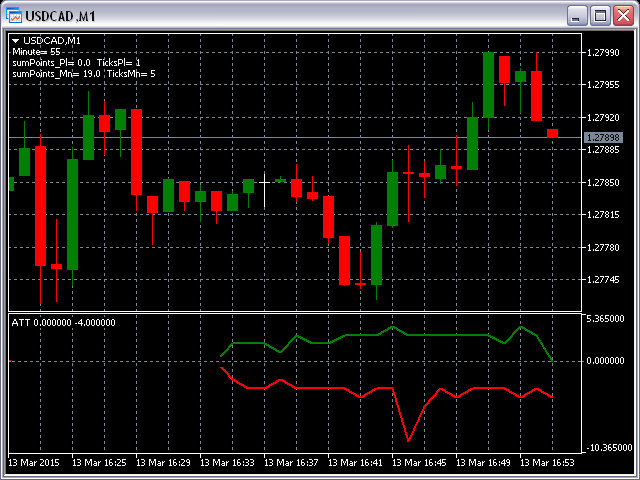
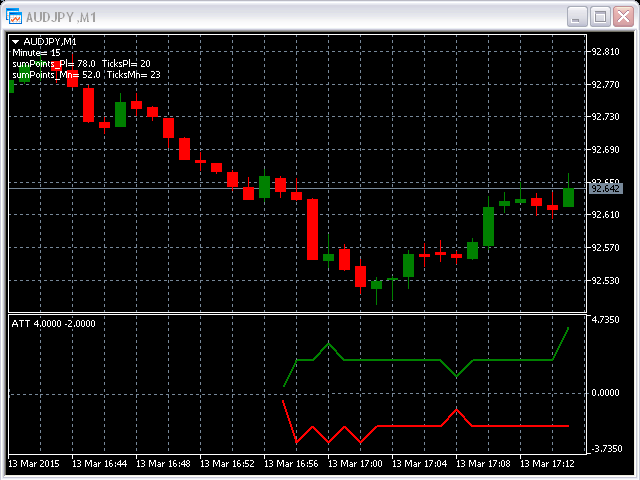
Dieser Indikator ist für den M1-Zeitrahmen konzipiert und zeigt 2 Linien an:
- Summe der Punkte, wenn der Preis nach oben geht, geteilt durch die Summe der Ticks, wenn der Preis nach oben geht (Farbe Aqua).
- DieSumme der Punkte, wenn der Kurs fällt, geteilt durch die Summe der Ticks, wenn der Kurs fällt (orange Farbe).
Sie sehen alle wichtigen Daten als Kommentar in der linken oberen Ecke des Charts.
Beachten Sie, dass die Summe der Punkte größer oder gleich der Summe der Ticks sein wird.
Natürlich berechnet der ATT alle Ticks nur vorwärts, beginnend mit dem Zeitpunkt, an dem Sie diesen Indikator auf den Chart setzen.