Ticks WPR
- Indicadores
- Versión: 1.12
- Actualizado: 17 noviembre 2021
- Activaciones: 5

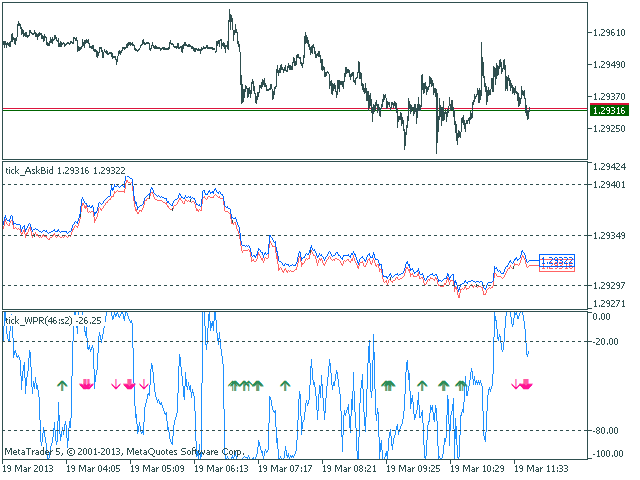
El indicador Williams' Percent Range (%R) dibujado usando un gráfico de ticks. Después de lanzarlo, espere a que vengan suficientes ticks.
Parámetros:
- Periodo WPR - periodo del indicador.
- Overbuyinglevel - nivel de sobrecompra.
- Overselling level - nivel de sobreventa.
- Сalculatedbar - número de barras para el cálculo del indicador.
Los siguientes parámetros sirven para ajustar el peso de las señales WPR (de 0 a 100). Usted puede encontrar su descripción en la sección Señales del Rango Porcentual Williams de la Referencia MQL5.
- El oscilador tiene dirección requerida.
- Retrocede detrás del nivel de sobrecompra/sobreventa.
- Divergencia del oscilador y el precio.
Índices del buffer: 0 - WPR, 1 - SIGNAL_UP, 2 - SIGNAL_DOWN.