Ticks MACD 4
- Indicadores
- Versión: 1.12
- Actualizado: 17 noviembre 2021
- Activaciones: 5

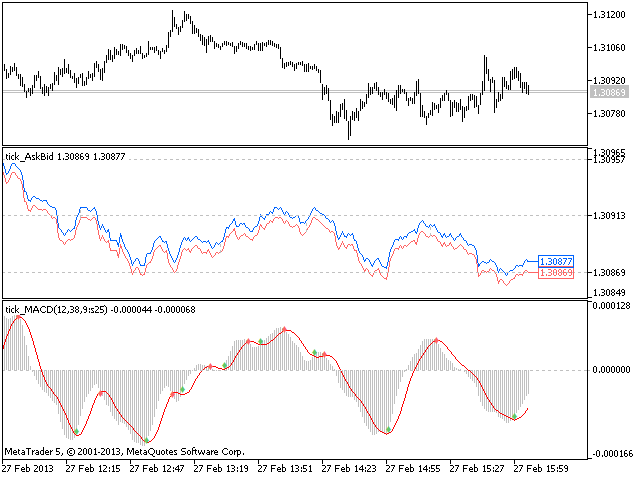
El indicador Moving Average Convergence/Divergence(MACD) dibujado usando un gráfico de ticks.
Después de lanzarlo, espere a que aparezcan suficientes ticks.
Parámetros:
- Periodo EMA rápido - indicador dibujado usando un gráfico de ticks.
- Periodo EMA Lento - periodo lento de promediación.
- Signal SMA period - periodo de promediación de la línea de señal.
- Barra calculada - número de barras en el gráfico para el cálculo del indicador.
Los siguientes parámetros sirven para ajustar el peso de las señales MACD (de 0 a 100). Puede encontrar su descripción en la sección Señales del oscilador MAC D de MQL5 Reference.
- El oscilador tiene la dirección requerida.
- Inversión del oscilador a la dirección requerida.
- Cruce de la línea principal y la línea de señal.
- Cruce de la línea principal y el nivel cero.
- Divergencia del oscilador y el precio.
- Doble divergencia del oscilador y el precio.
Índices del buffer: 0 - MACD_LINE, 1 - SIGNALLINE, 4- SIGNAL_UP, 5- SIGNAL_DOWN.