TimeFilter simple
- Indicadores
- Versión: 1.12
- Actualizado: 17 noviembre 2021
- Activaciones: 5

El indicador es un filtro horario intersemanal.
Al ejecutar operaciones de trading, el indicador permite considerar las características horarias de cada sesión de trading.
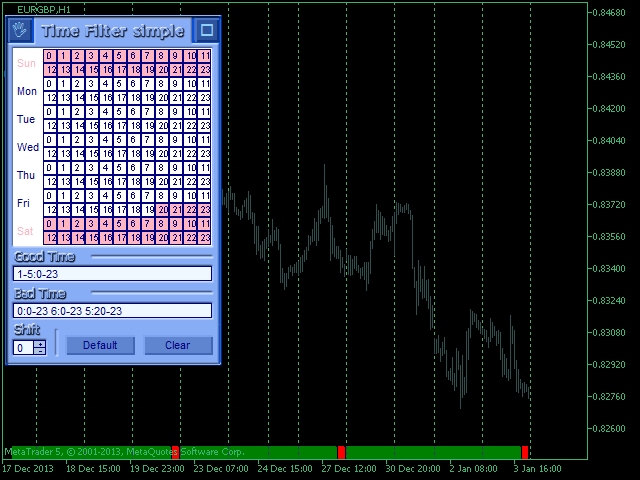
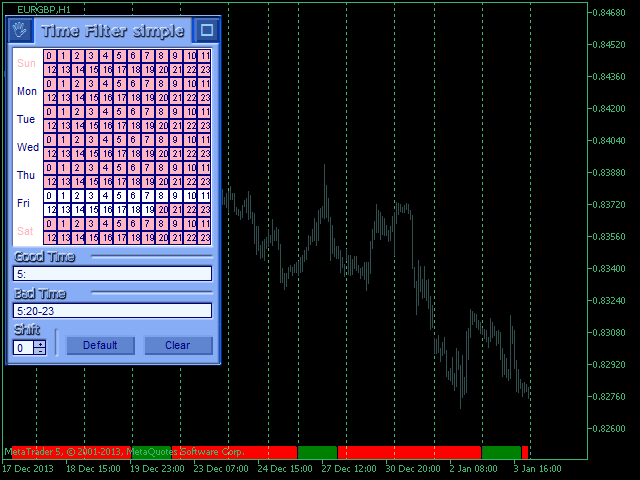
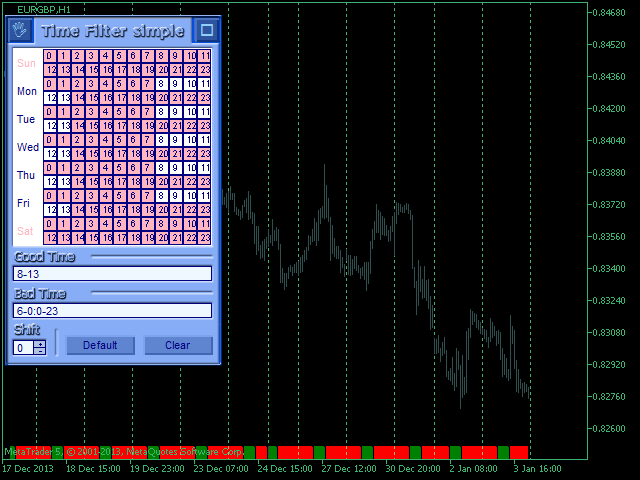
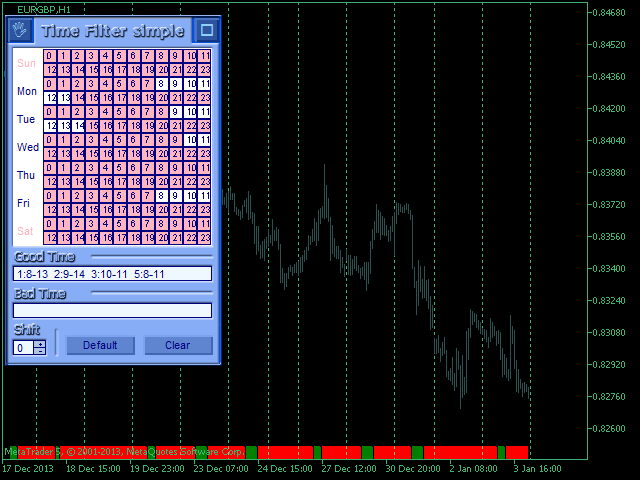
Los intervalos permisivos y restrictivos del filtro se establecen en forma de cadena. El formato utilizado es [primer día]-[último día]:[primera hora]-[última hora]. Vea los ejemplos en las capturas de pantalla.
Parámetros:- Buen momento para operar - intervalos en los que se permite operar.
- Mal momento para operar - intervalos en los que está prohibido operar.
- turno de filtro de tiempo (horas) - turno por hora.
- porcentaje de llenado - valor de indicación.
- Mostrar On/Off - activar/desactivar la visualización del filtro.
Uso en Asesores Expertos: buffer 0 igual a 0 - el comercio está prohibido, de lo contrario - permitido.


El usuario no ha dejado ningún comentario para su valoración