Ticks CCI 4
- Indicadores
- Versión: 1.12
- Actualizado: 17 noviembre 2021
- Activaciones: 5

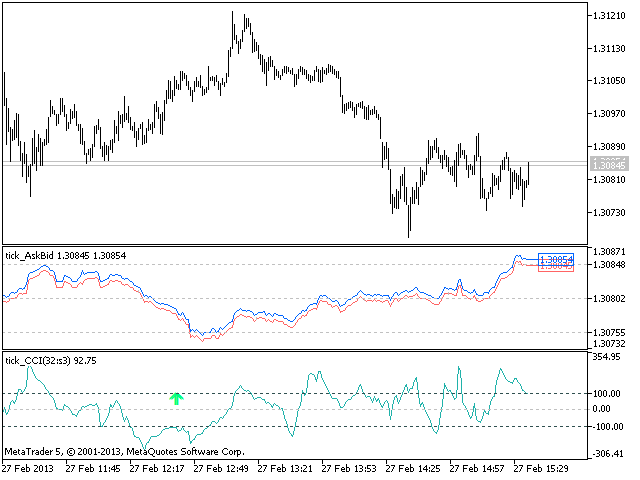
El indicador Commodity Channel Index(CCI) dibujado utilizando un gráfico de ticks.
Después de lanzarlo, espere a que aparezcan suficientes ticks.
Parámetros:
- period - número de periodos individuales utilizados para el cálculo del indicador.
- barra calculada - número de barras para el cálculo del indicador.
Los siguientes parámetros sirven para ajustar el peso de las señales CCI (de 0 a 100). Puede encontrar su descripción en la sección Señales del Commodity Channel Index de MQL5 Reference.
- El oscilador tiene dirección requerida.
- Retrocede detrás del nivel de sobrecompra/sobreventa.
- Divergencia del oscilador y el precio.
- Doble divergencia del oscilador y el precio.
Índices de amortiguación: 0 - CCI_LINE, 1 - SIGNAL_UP, 2 - SIGNAL_DOWN.