ATR Scanner Pro MT4
- Indicadores
- Versión: 1.40
- Actualizado: 9 junio 2024
- Activaciones: 15

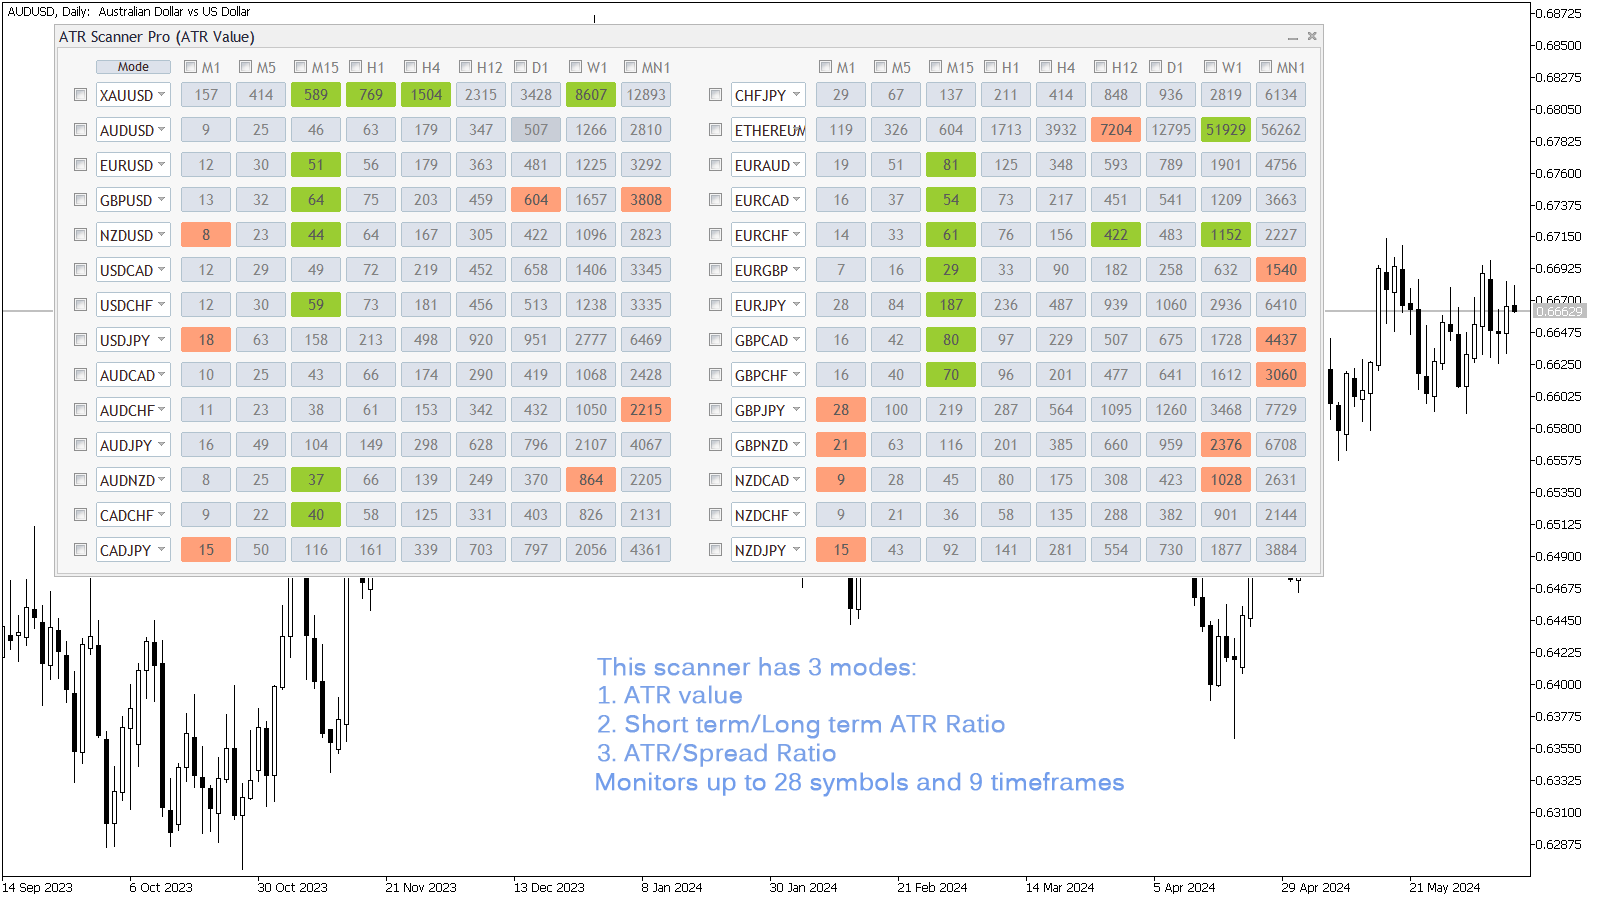
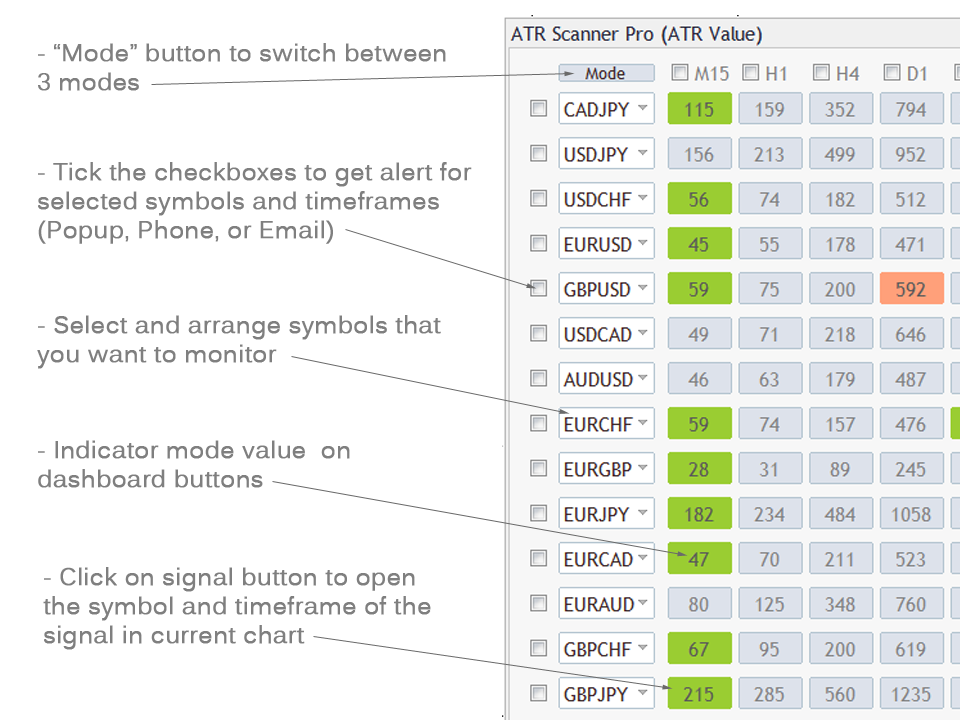
ATR Scanner Pro es un escáner de volatilidad multi símbolo y multi timeframe que monitoriza y analiza el valor del indicador Average True Range en hasta 28 símbolos y 9 timeframes en 3 modos :
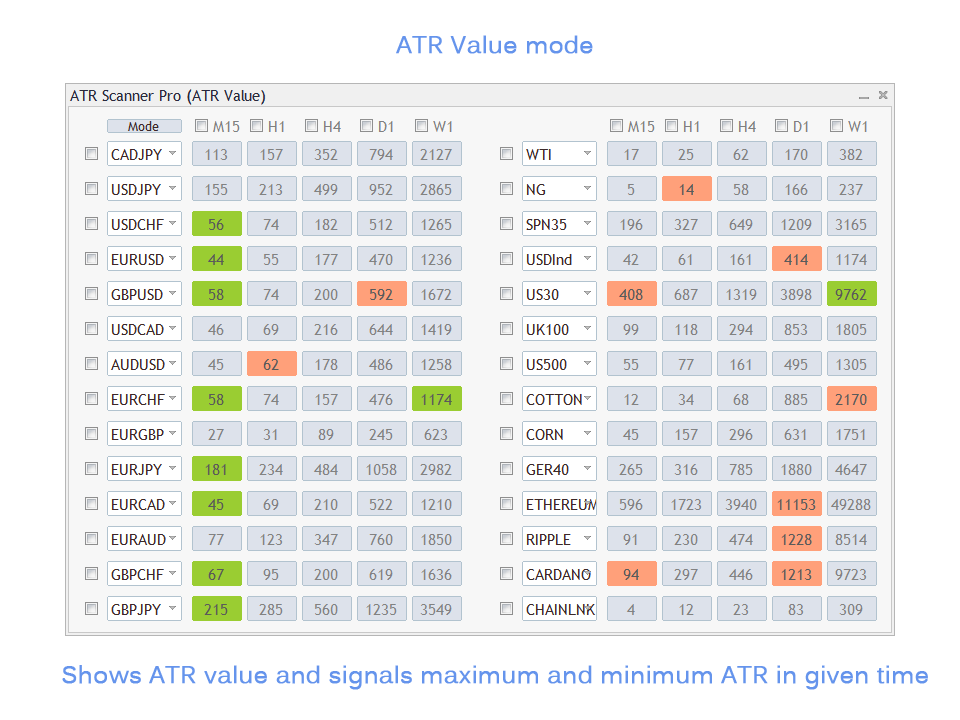
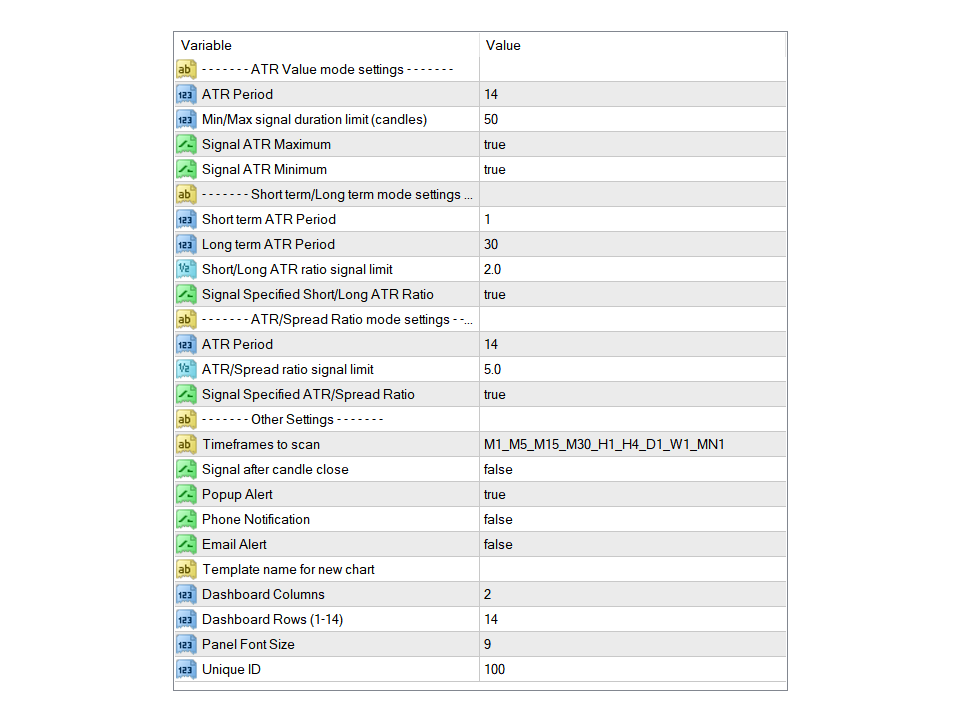
- Valor ATR: Como panel de volatilidad muestra el valor del indicador ATR en todos los pares y plazos y señala cuando el valor ATR alcanza un máximo o un mínimo en una duración determinada.
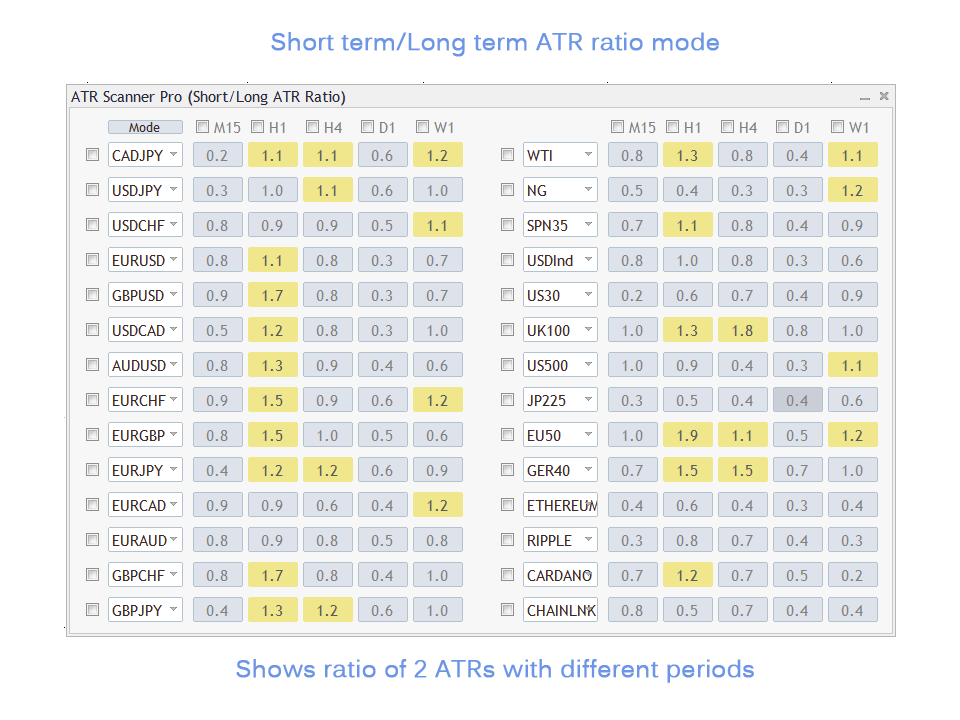
- Relación ATR corto plazo/ATR largo plazo: Muestra la relación de 2 ATRs con diferentes periodos. Es útil para detectar volatilidad a corto plazo y movimientos explosivos.
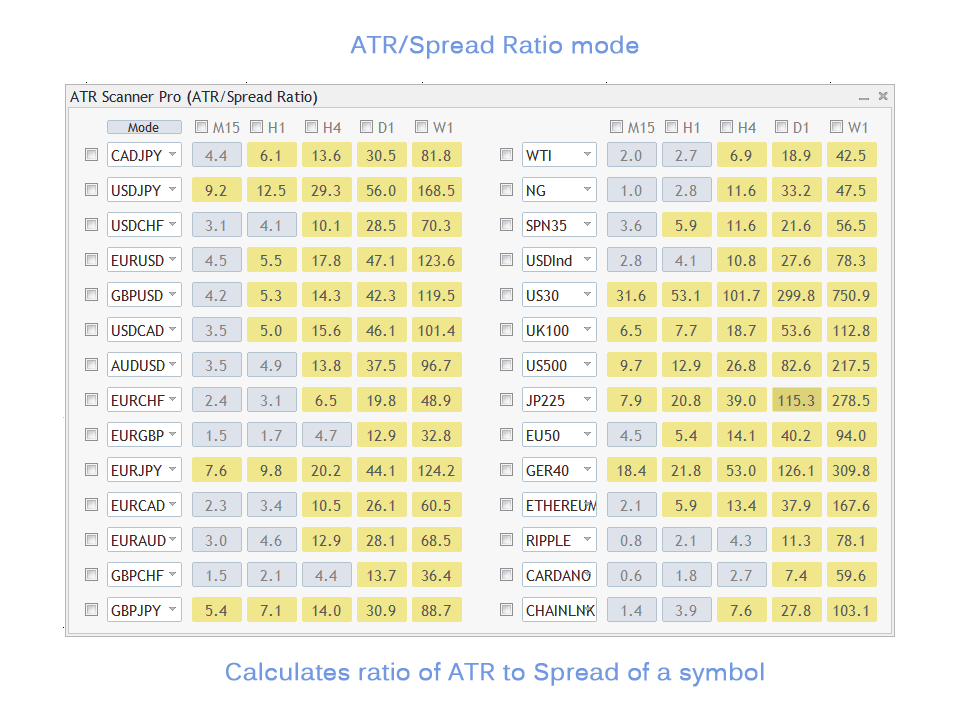
- Ratio ATR Value/Spread: Muestra el ratio de ATR y spread del símbolo útil para elegir un símbolo para operar teniendo en cuenta la gestión monetaria especialmente cuando operamos en timeframes inferiores. (scalping)
Características de ATR Scanner Pro:
- Monitoriza 28 instrumentos personalizables y 9 timeframes al mismo tiempo.
- Alertas emergentes, por correo electrónico y por teléfono para los símbolos y plazos seleccionados.
- Revisión rápida de las señales en el mismo gráfico haciendo clic en los botones de señal.
Notas
- Si desea supervisar más de 28 instrumentos, puede cargar el indicador en otro gráfico con un "ID único" diferente en la configuración y establecer diferentes símbolos para él.
- Los símbolos que desea añadir al tablero ATR deben ser visibles en la ventana de vigilancia del mercado MetaTrader. La primera vez que ejecute el indicador o cargar un nuevo símbolo en el tablero de instrumentos que puede tardar unos segundos para actualizar sus datos y mostrar señales.
Si usted opera con fuertes movimientos de precios o cualquier tipo de rupturas de consolidación, es posible que desee probar el Multiplicadorde Recompensa.