RSI Divergence Scanner MT4
- Utilidades
- Versión: 6.3
- Actualizado: 2 noviembre 2023
- Activaciones: 15

RSI Divergence Scanner es un panel de control y alerta multi-marco de tiempo y multi-símbolo que comprueba todos los marcos de tiempo y símbolos para encontrar divergencias entre el gráfico de precios y el indicador RSI.
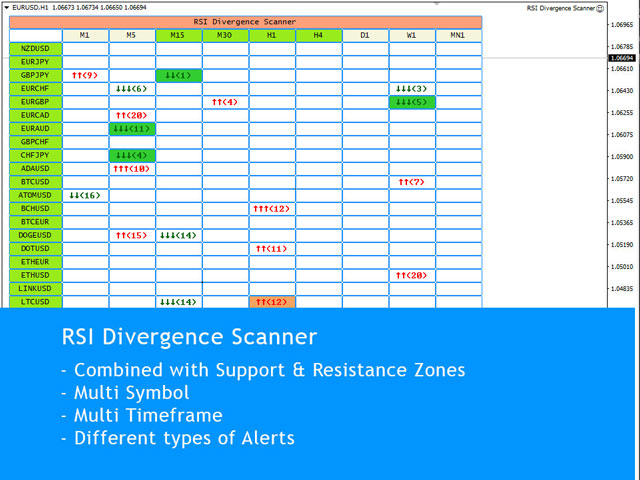
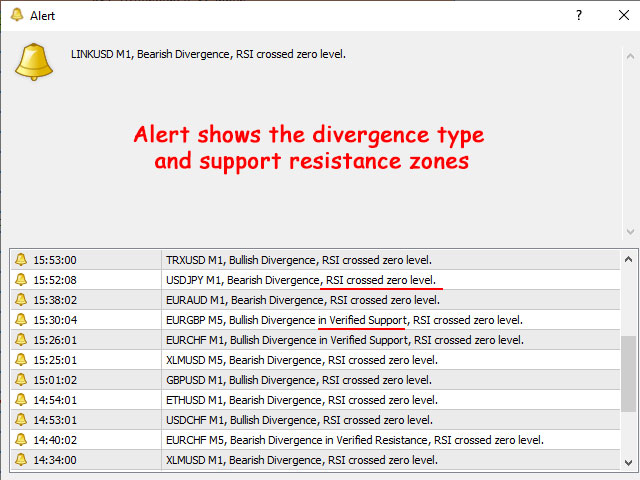
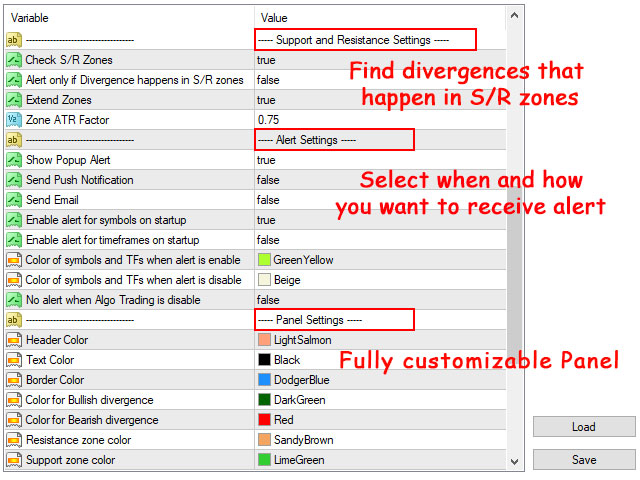
Este escáner de divergencias está integrado con zonas de soporte y resistencia para que pueda comprobar las divergencias del RSI en las zonas más importantes del gráfico para encontrar cambios de tendencia en el gráfico de precios.
Descargar versión demo ( funciona en M 1,M5,M30,W1 timeframes)
Descripción completa de los parámetros del escáner -> haga clic aquí.
Cómo aprovechar al máximo el escáner -> lea este artículo.
El uso delas divergenciasdel RSIjunto con otras herramientas técnicas como la acción del precio, los patrones de velas y las zonas de soporte y resistencia proporciona señales fiables para posibles cambios de tendencia.
Si está utilizando la Divergencia RSI en su estrategia de trading, este escáner le ayuda a encontrar las mejores oportunidades para operar sin pasar mucho tiempo frente a su sistema.
Características del Escáner de Divergencia RSI:
- El escáner encuentra divergencias regulares (clásicas) y ocultas
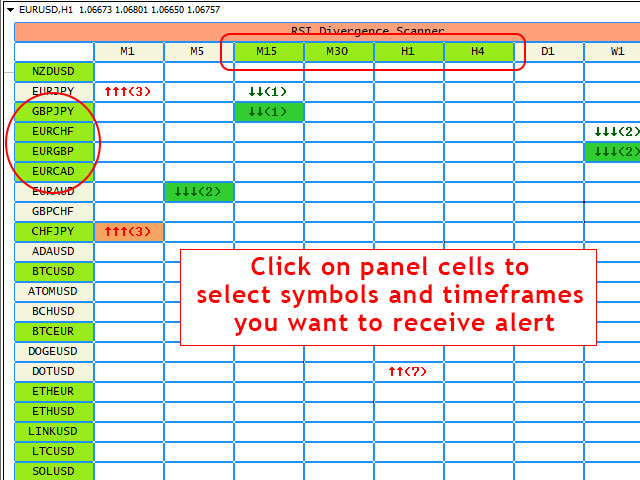
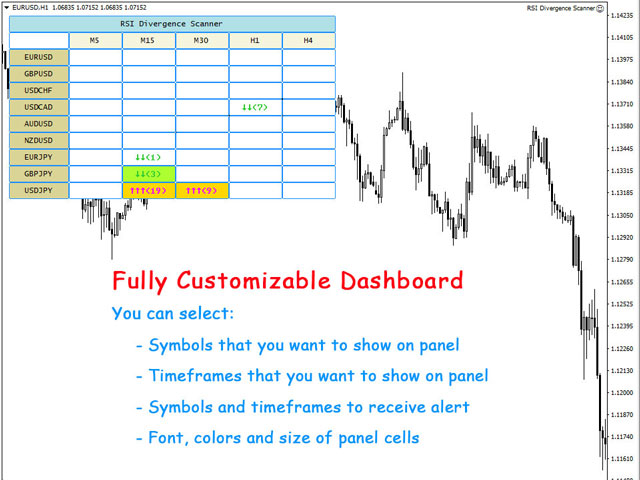
- Ejecute el panel en un gráfico y vea la Divergencia RSI para todos los símbolos y plazos seleccionados.
- Puede configurar el escáner para que sólo busque divergencias que se produzcan en niveles de sobrecompra/sobreventa (puede configurar los niveles en los parámetros).
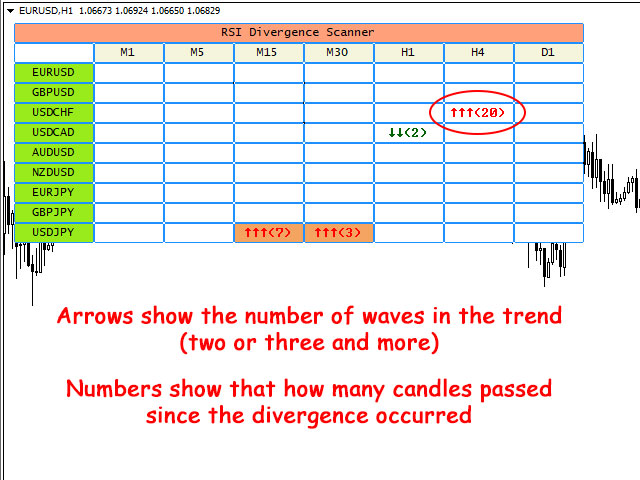
- El panel muestra cuántas velas han pasado desde que se produjo la divergencia.
- El panel muestra el número de ondas de tendencia (2 o 3 y más) que lleva a la divergencia.
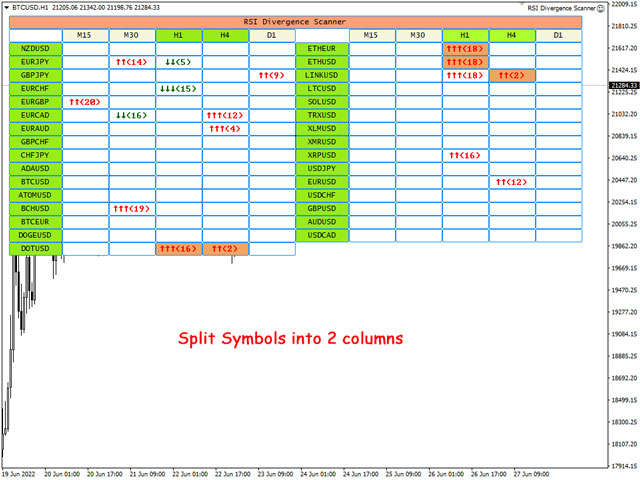
- Puede dividir los símbolos en 2 o 3 columnas para mostrar más símbolos en el gráfico.
- Al hacer clic en las celdas de la tabla, puede ver la zona S/R, la línea de divergencia y la flecha de divergencia en el gráfico de precios abierto.
- Puede separar los símbolos en múltiples tableros con diferentes parámetros para cada tablero (por ejemplo para diferentes mercados).
- Puede activar/desactivar alertas para símbolos y plazos directamente desde el panel del escáner.
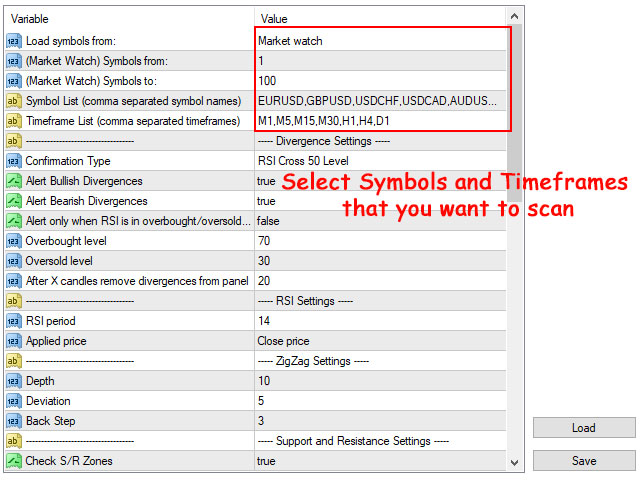
- El escáner funciona en todos los mercados(Forex, Acciones, Índices, Materias Primas, Cripto ...), puede escribir los nombres de los símbolos en la configuración (separados por comas) o simplemente configurar el escáner para que lea los símbolos desde market watch.
Diferentes confirmaciones para divergencias
Hay 6 opciones de confirmación para las divergencias RSI que puede seleccionar en los parámetros de entrada:
- Patrones de Velas
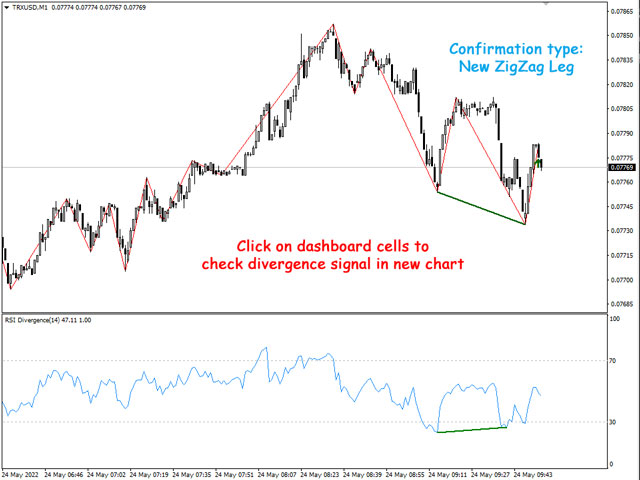
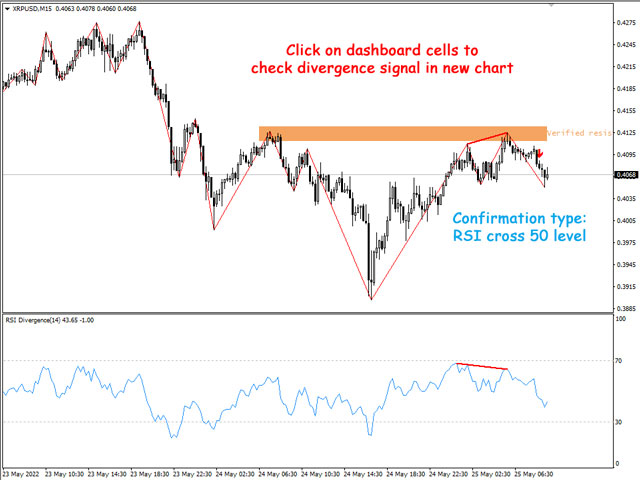
- La línea RSI cruza el nivel 50
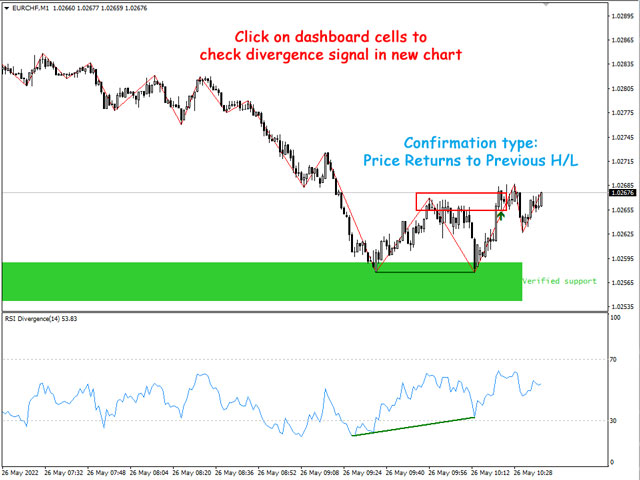
- El precio vuelve al H/L anterior
- Cambio de color del indicador Heiken Ashi
- Vela de reversión fuerte (puede no suceder)
- Alerta inmediata sin confirmación
Integrado con zonas de soporte y resistencia
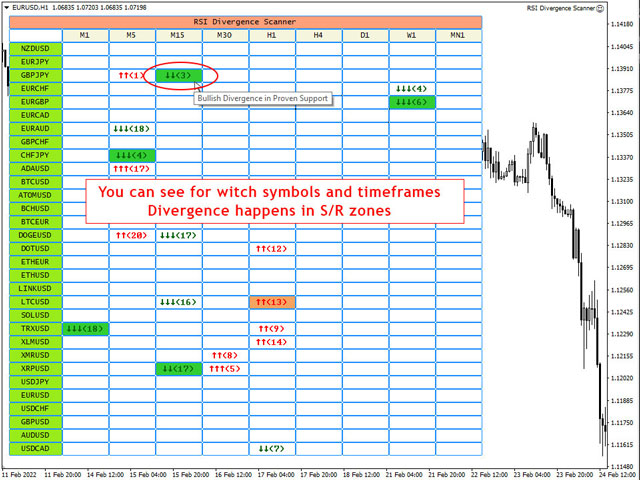
- Puede configurar el escáner para que sólo reciba alertas de divergencias RSI que se encuentren dentro de las zonas de soporte y resistencia.
- Puede ver qué divergencias RSI se producen en las zonas de soporte y resistencia a través de los colores de las celdas.
- Puede establecer los parámetros para las zonas de soporte y resistencia en los parámetros de entrada del escáner.
- Las zonas de soporte y resistencia se calculan en base al indicador de oferta y demanda Shved que puede descargar gratuitamente desdeeste enlace (el escáner no lo necesita).
Diferentes tipos de alertas:
- Mostrar alerta emergente: Muestra una ventana de alerta cuando se activa la alerta del escáner.
- Enviar notificación push: Envía una notificación push al teléfono móvil cuando se activa la alerta del escáner. (Debe configurar las opciones de Notificaciones de metatrader)
- Enviar Email: Enviar correo electrónico cuando se activa la alerta de escáner. (Debe configurar las opciones de correo electrónico de metatrader)
Notas:
- RSI Divergence Scanner utiliza el indicador ZigZag para determinar la dirección de la tendencia y HH/LL del precio, puede cambiar los parámetros de ZigZag en la ventana de entrada del indicador.
- Puede añadir elindicador gratuitoRSI Divergence a su plantilla de gráfico predeterminada, de modo que cuando haga clic en las celdas del tablero, podrá ver la divergencia en el gráfico abierto (el tablero no necesita el indicador para ejecutarse).
- El dashboard funciona sin problemas para 70 símbolos y los 9 timeframes en un PC medio, puedes añadir más símbolos cuando reduzcas el número de timeframes.
- Si hay muchos símbolos en la vigilancia del mercado, en la primera ejecución del escáner en el gráfico puede tardar algún tiempo en cargar los datos históricos para todos los marcos temporales de todos los símbolos.
- Si no quiere encontrar divergencias RSI en los timeframes W1 y MN1, no los cargue en el tablero. Los gráficos deben tener al menos 300 velas para comprobar la tendencia y encontrar las divergencias.
- El tablero se actualiza cada 1 minuto de apertura de vela, ejecútelo en los símbolos más volátiles como EURUSD y BTCUSD para recibir nuevos precios más rápido.


Tried a bunch of RSI divergence indicators before, but once I found Amir’s "RSI Divergence Scanner" — game changer! Super helpful and accurate. Makes my analysis way easier and now it’s a must-have in my daily trading setup. Big thanks to Amir for this awesome tool!