Support Resistance Risk Management MT5
- Indicadores
-
Young Ho Seo
 Harmonic Pattern Indicator - Repainting + Japanese Candlestick Pattern Scanner + Automatic Channel + Many more
https://www.mql5.com/en/market/product/4488 - Versión: 2.6
- Actualizado: 16 febrero 2022
- Activaciones: 5
Introducción a la gestión del riesgo de resistencia al soporte
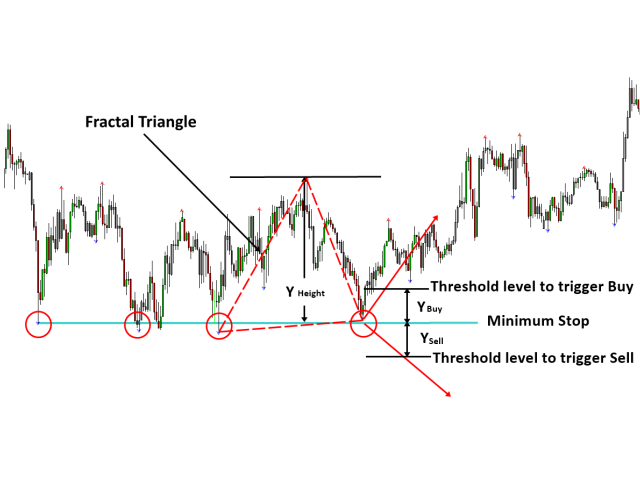
El soporte-resistencia es el análisis técnico en el que más se confía. Sin embargo, la gestión del riesgo para el soporte y la resistencia no se practica a menudo. Por lo tanto, proporcionamos un método eficaz de gestión de riesgos para el trader de soporte y resistencia. En el libro: Scientific Guide To Price Action and Pattern Trading (Wisdom of Trend, Cycle, and Fractal Wave), se describe cómo utilizar la Resistencia de Soporte, así como el Análisis de Fibonacci, el Patrón Armónico, la Teoría de la Onda de Elliott y el Patrón Gráfico X3. En el libro, se introduce el concepto "Trigger Level" para soporte y resistencia. Trigger Level es el precio de entrada compensado desde el soporte y la resistencia basado en el Triángulo Fractal. Este concepto de nivel de activación se introdujo para evitar la falsa ruptura o la falsa señal de reversión alrededor del soporte y la resistencia, así como para el riesgo. La esencia del concepto de nivel de activación es utilizar el triángulo fractal alrededor del soporte y la resistencia para establecer el stop mínimo, la entrada y el objetivo de beneficios. Proporcionamos dos implementaciones de este concepto de nivel de activación, incluyendo el nivel de activación simétrico y el retroceso simétrico de Fibonacci.
Identificar soportes y resistencias para operar
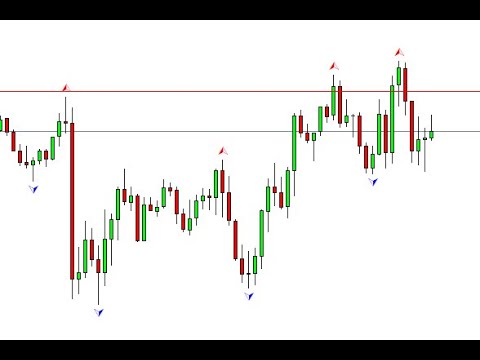
Soporte y Resistencia fue creado originalmente para reaccionar al mercado (Aunque puede predecir la dirección del mercado. No vamos a explicar esto aquí). Utilice el Análisis de Picos y Caídas proporcionado para identificar el Soporte o Resistencia importante. Una vez que haya dibujado la línea de soporte o resistencia en su gráfico, la mitad del trabajo está hecho. A continuación, espere hasta que el precio sea empujado en una dirección por la multitud, entonces seguirá el precio (=reaccione al mercado). Este es el esquema más genérico para operar con soporte y resistencia.
Gestión del riesgo con soportes y resistencias
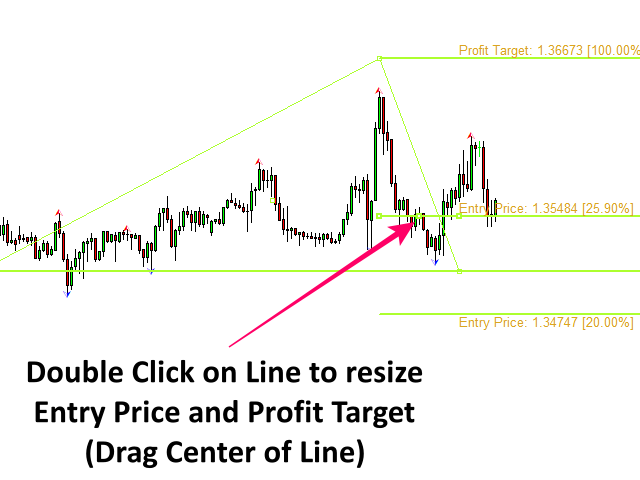
Una vez que haya trazado el soporte o la resistencia, el concepto de nivel de activación le sugiere que identifique tres precios importantes, incluidos el tope mínimo, el precio de entrada y el objetivo de beneficios para gestionar el riesgo.
* Tope mínimo: Suele ser el propio soporte o resistencia. Como el precio puede revestir el soporte o la resistencia, es mejor proporcionar cierto margen a partir de este nivel mínimo de Stop Loss.
* Precio de entrada: El precio de entrada se utiliza para evitar falsas rupturas o falsas señales de reversión. Ya sea que esté operando con la primera o tercera onda desde el soporte o resistencia, este precio es importante.
* Objetivo de Ganancia: El primer nivel de precio que puede utilizar como objetivo de beneficios es la altura del Triángulo Fractal, ya que asumimos que el precio puede volver a visitar el pico o valle en su gráfico. Dependiendo de las condiciones del mercado, su objetivo de ganancias puede ser mayor que la altura del Triángulo Fractal. Si las condiciones del mercado son menos favorables para la dirección de la operación, puede establecer un objetivo de beneficios ligeramente inferior a la altura del triángulo fractal.
Añadir herramientas de gestión de riesgos al gráfico
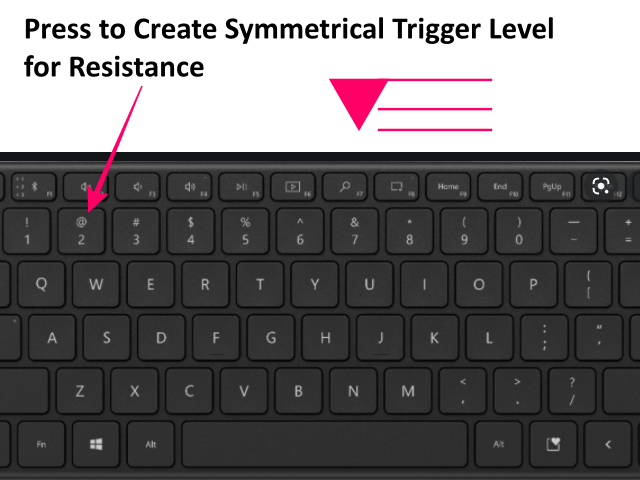
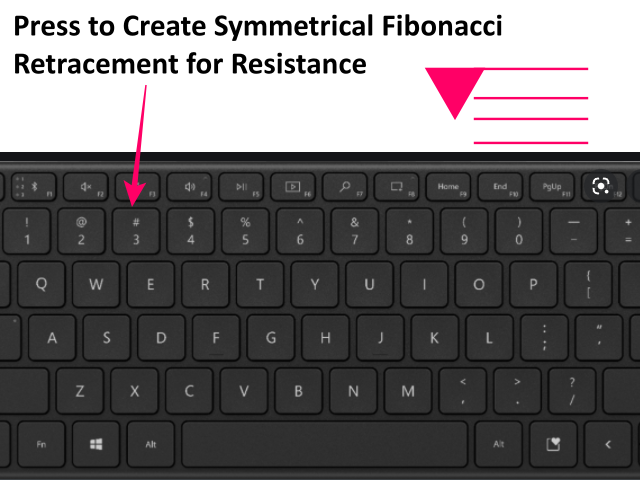
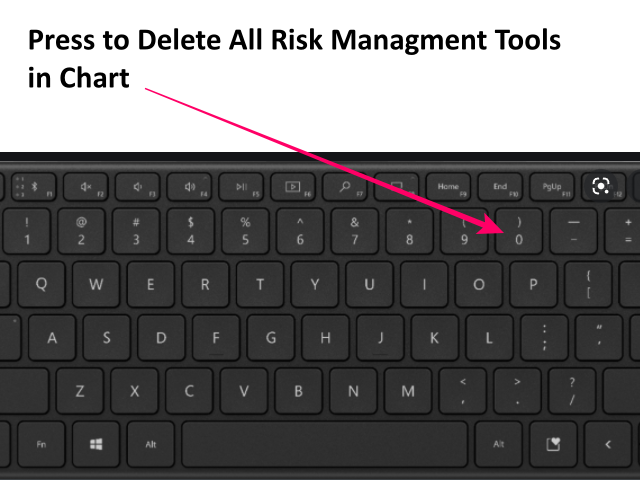
Puede acceder a la herramienta de gestión de riesgos desde Gestión de riesgos de resistencia y soporte utilizando las teclas numéricas. En primer lugar, adjunte el indicador a su gráfico. A continuación, utilice las siguientes teclas numéricas para insertar o eliminar las herramientas de gestión de riesgos.
Tecla numérica 0: Borrar todas las herramientas de gestión de riesgos del gráfico
Tecla numérica 1: Añada un Nivel de activación simétrico para el Soporte o triángulo fractal de cresta a valle.
Tecla numérica 2: Añada un Nivel de activación simétrico para Resistencia o triángulo fractal de pico a valle.
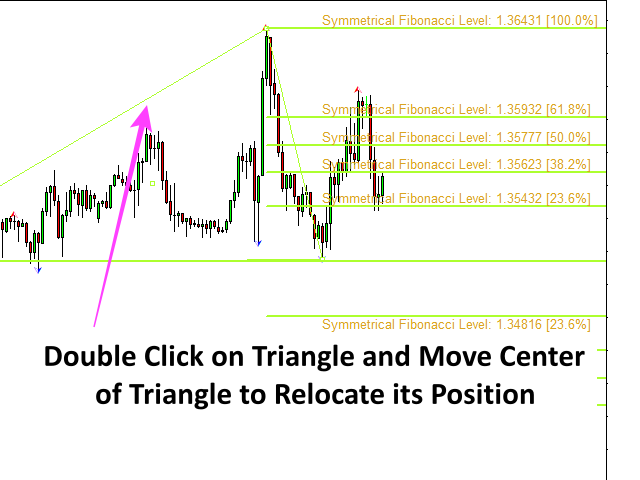
Clave numérica 3: Añada un Retroceso Simétrico de Fibonacci para el Soporte o triángulo fractal de cresta a valle.
Tecla numérica 4: Añada un retroceso simétrico de Fibonacci para resistencia o triángulo fractal de cresta a valle.
Arrastre para ajustar la ubicación y el tamaño
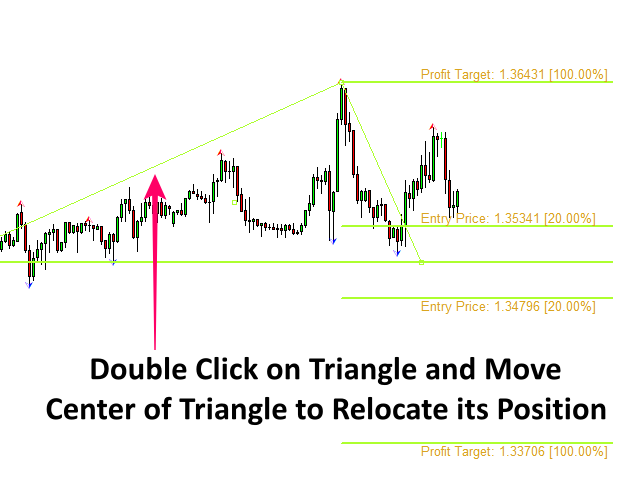
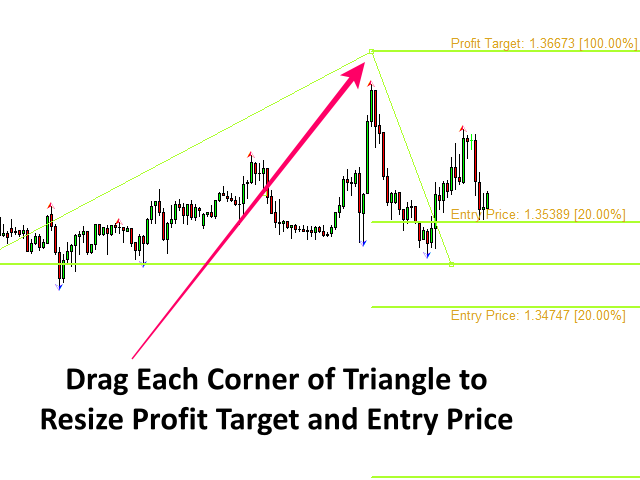
Una vez añadida la herramienta de gestión de riesgos a un gráfico, puede reubicar la herramienta arrastrando el centro del triángulo fractal. Arrastrando la esquina superior o inferior del triángulo, también puede ajustar el tamaño del triángulo fractal al soporte y a la resistencia. Su tarea consiste en identificar el triángulo fractal.
Indicador de Alerta
Puede dibujar el soporte y la resistencia antes de que el precio se acerque al soporte y a la resistencia. En este caso, es posible que tenga que esperar hasta que el precio se acerque al soporte o a la resistencia. El indicador enviará la alerta cuando el precio llegue cerca del soporte o resistencia. Contrólelo mediante "Entrada de porcentaje de alerta".
Guía del Indicador Soporte Resistencia
https://www.mql5.com/en/blogs/post/750387