Support Resistance Risk Management MT5
- Indikatoren
-
Young Ho Seo
 Harmonic Pattern Indicator - Repainting + Japanese Candlestick Pattern Scanner + Automatic Channel + Many more
https://www.mql5.com/en/market/product/4488 - Version: 2.6
- Aktualisiert: 16 Februar 2022
- Aktivierungen: 5
Einführung in das Risikomanagement von Support Resistance
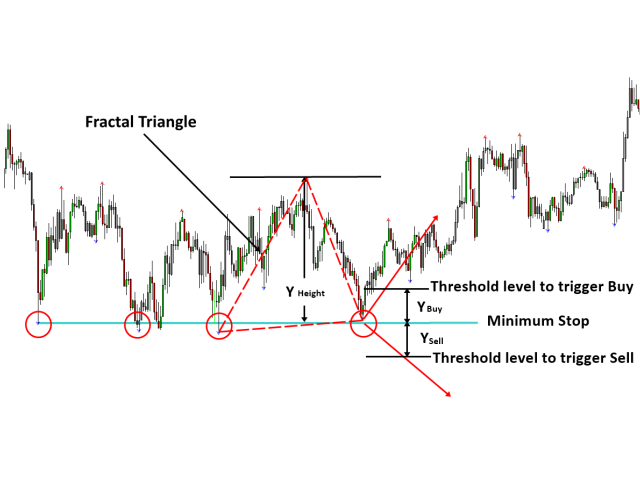
Support Resistance ist die vertrauenswürdigste technische Analyse. Allerdings wird das Risikomanagement für die Unterstützung und den Widerstand nicht oft praktiziert. Daher stellen wir eine effektive Risikomanagement-Methode für den Unterstützungs- und Widerstandshändler vor. In dem Buch: Scientific Guide To Price Action and Pattern Trading (Wisdom of Trend, Cycle, and Fractal Wave) wird beschrieben, wie man Support Resistance, Fibonacci Analysis, Harmonic Pattern, Elliott Wave Theory und X3 Chart Pattern verwendet. In dem Buch wurde das Konzept "Trigger Level" für Unterstützung und Widerstand eingeführt. Trigger Level ist der Einstiegskurs, der von der Unterstützung und dem Widerstand auf der Grundlage des Fraktalen Dreiecks abweicht. Dieses Trigger Level-Konzept wurde eingeführt, um falsche Ausbruchs- oder Umkehrsignale im Bereich der Unterstützung und des Widerstands sowie das Risiko zu vermeiden. Das Wesen des Trigger-Level-Konzepts besteht darin, das fraktale Dreieck um die Unterstützung und den Widerstand zu nutzen, um einen Mindeststopp, einen Einstieg und ein Gewinnziel festzulegen. Wir bieten zwei Implementierungen dieses Trigger-Level-Konzepts an, darunter das symmetrische Trigger-Level und das symmetrische Fibonacci-Retracement.
Identifizieren Sie Unterstützung und Widerstand für den Handel
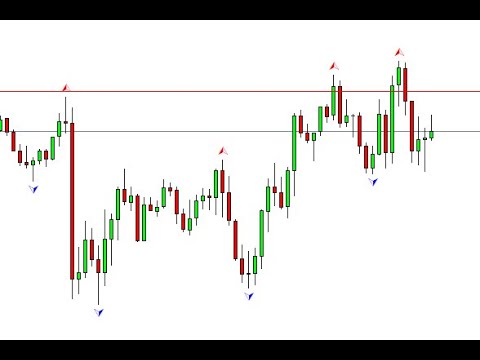
Unterstützung und Widerstand wurden ursprünglich geschaffen, um auf den Markt zu reagieren (obwohl sie die Marktrichtung vorhersagen können, werden wir dies hier nicht erklären). Verwenden Sie die mitgelieferte Peak-Trough-Analyse, um die wichtigen Unterstützungen und Widerstände zu identifizieren. Sobald Sie die Unterstützungs- oder Widerstandslinie in Ihrem Chart eingezeichnet haben, ist die Hälfte der Arbeit getan. Als nächstes warten Sie, bis der Preis von der Masse in eine Richtung getrieben wird, dann folgen Sie dem Preis (=reagieren auf den Markt). Das ist das genetischste Schema für den Handel mit Unterstützung und Widerstand.
Risikomanagement mit Unterstützung/Widerstand
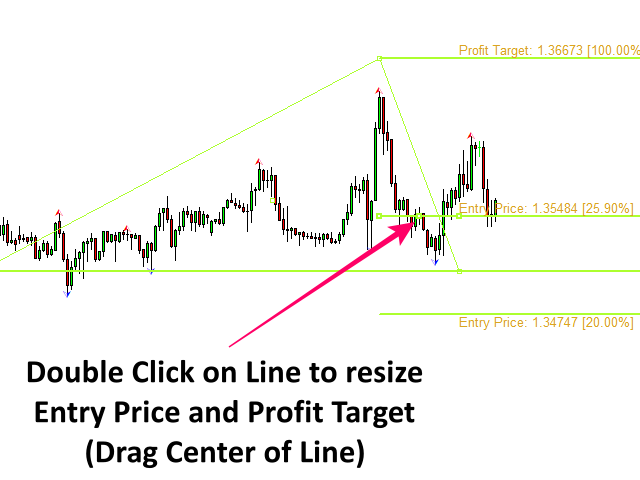
Sobald Sie die Unterstützung oder den Widerstand eingezeichnet haben, schlägt Ihnen das Konzept der Auslöseschwelle vor, drei wichtige Preise zu bestimmen, darunter den Mindeststopp, den Einstiegspreis und das Gewinnziel, um das Risiko zu steuern.
* Mindeststopp: Dies ist oft die Unterstützung oder der Widerstand selbst. Da der Preis die Unterstützung oder den Widerstand umkehren kann, ist es am besten, eine gewisse Marge von diesem minimalen Stop-Loss-Niveau vorzusehen.
* Einstiegskurs: Der Einstiegskurs wird verwendet, um einen falschen Ausbruch oder ein falsches Umkehrsignal zu vermeiden. Unabhängig davon, ob Sie mit der ersten Welle oder der dritten Welle vom Unterstützungswiderstand handeln, ist dieser Preis wichtig.
* Gewinnziel: Das erste Kursniveau, das Sie als Gewinnziel verwenden können, ist die Höhe des Fraktalen Dreiecks, da wir davon ausgehen, dass der Kurs den Höchst- oder Tiefststand in Ihrem Chart wieder erreichen kann. Je nach Marktlage kann Ihr Gewinnziel größer sein als die Höhe des Fraktalen Dreiecks. Wenn die Marktbedingungen weniger günstig für die Handelsrichtung sind, können Sie das Gewinnziel etwas niedriger als die Höhe des Fraktalen Dreiecks festlegen.
Risikomanagement-Tools zum Chart hinzufügen
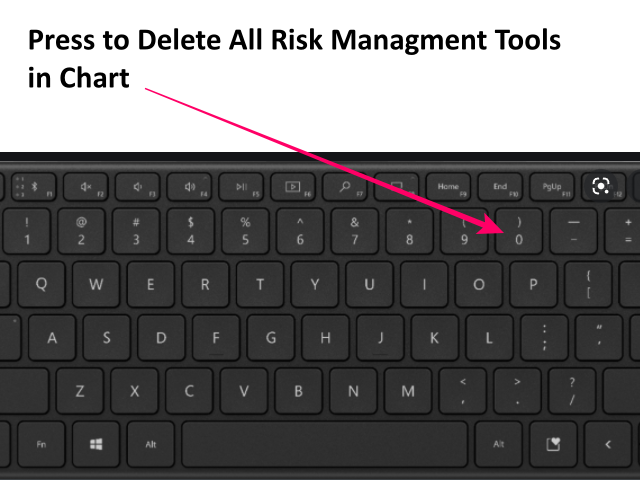
Sie können das Risikomanagement-Tool über das Support Resistance Risk Management mit den Zifferntasten aufrufen. Befestigen Sie zunächst den Indikator an Ihrem Chart. Verwenden Sie dann die folgenden Zifferntasten, um die Risikomanagement-Tools einzufügen oder zu löschen.
Zifferntaste 0: Alle Risikomanagement-Tools in Ihrem Chart löschen
Zifferntaste 1: Fügen Sie ein symmetrisches Trigger-Level für Unterstützung oder ein fraktales Dreieck mit Tiefpunkt und Tiefpunkt hinzu.
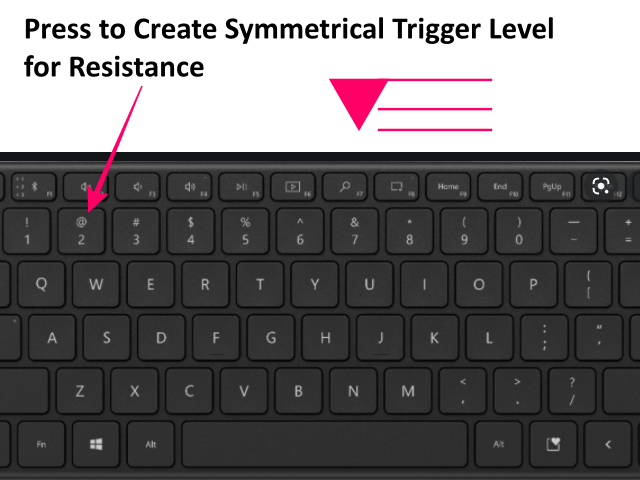
Nummerntaste 2: Fügen Sie ein symmetrisches Trigger-Level für Widerstand oder für ein fraktales Dreieck mit Spitze-Trog-Spitze hinzu.
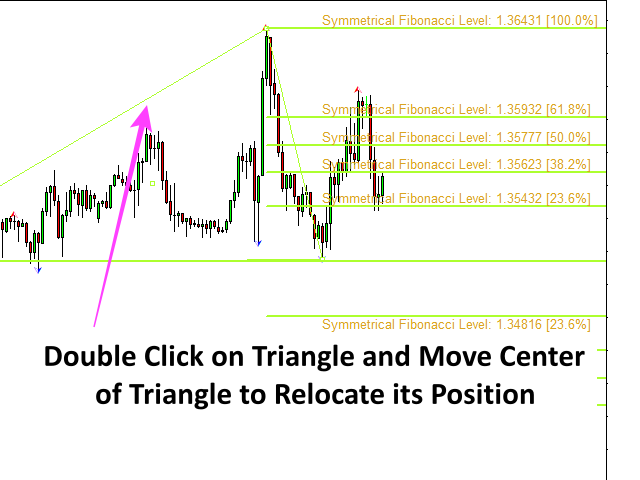
Taste 3: Fügen Sie ein symmetrisches Fibonacci-Retracement für die Unterstützung oder das fraktale Dreieck mit der Spitze der Mulde der Mulde hinzu.
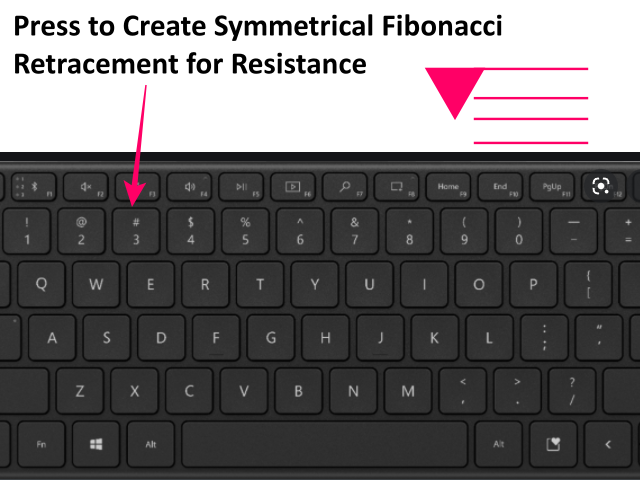
Zahlentaste 4: Fügen Sie ein symmetrisches Fibonacci-Retracement für den Widerstand oder das fraktale Dreieck mit dem Peak-Trough-Peak hinzu.
Ziehen, um Position und Größe anzupassen
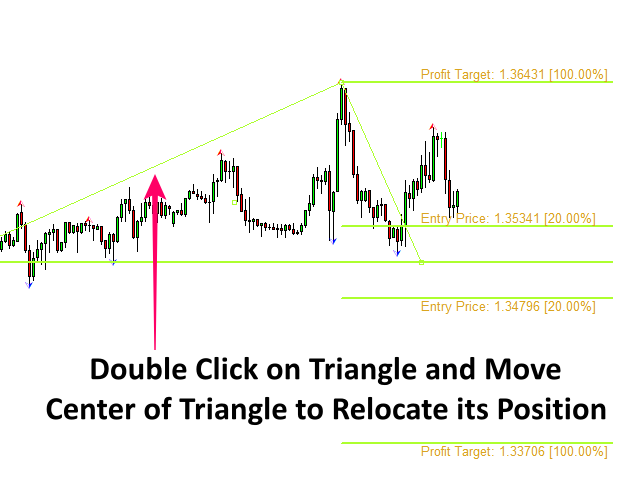
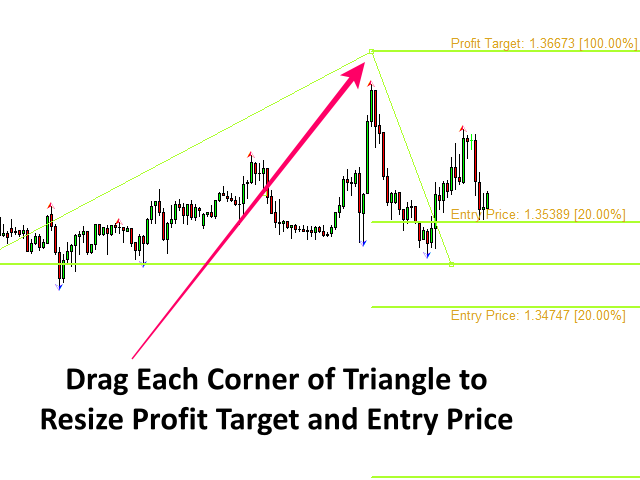
Sobald das Risikomanagement-Tool zu einem Diagramm hinzugefügt wurde, können Sie das Tool durch Ziehen der Mitte des fraktalen Dreiecks verschieben. Durch Ziehen der oberen oder unteren Ecke des Dreiecks können Sie auch die Größe des fraktalen Dreiecks an Unterstützung und Widerstand anpassen. Ihre Aufgabe ist es, das Fraktale Dreieck zu identifizieren.
Indikator-Warnung
Sie können die Unterstützung und den Widerstand einzeichnen, bevor sich der Preis der Unterstützung und dem Widerstand nähert. In diesem Fall müssen Sie möglicherweise warten, bis sich der Preis der Unterstützung oder dem Widerstand nähert. Wenn das Risikomanagement-Tool platziert wird, sendet es einen Alarm, wenn der Kurs in die Nähe der Unterstützung oder des Widerstands kommt. Sie können dies über die Eingabe von "Alert Percent" steuern.
Unterstützung-Widerstand-Indikator Leitfaden
https://www.mql5.com/en/blogs/post/750387