MACD Control Panel MT4
- Indicadores
- Versión: 4.4
- Actualizado: 23 mayo 2020
- Activaciones: 5

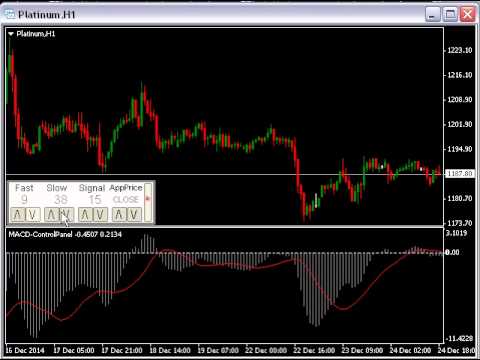
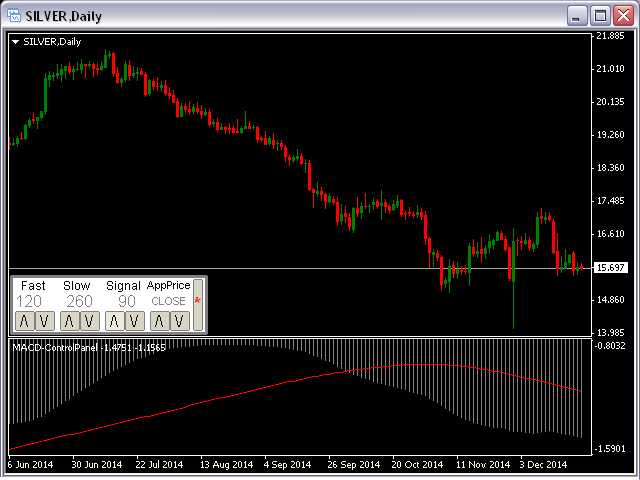
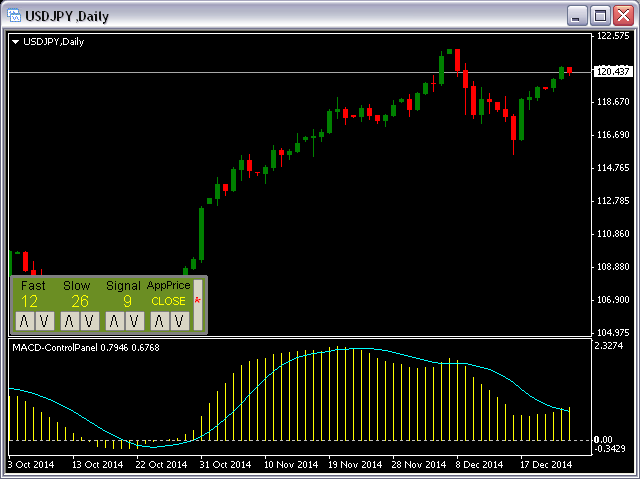
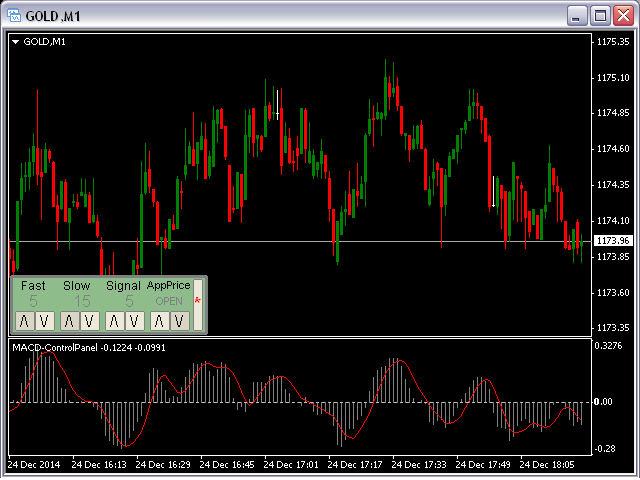
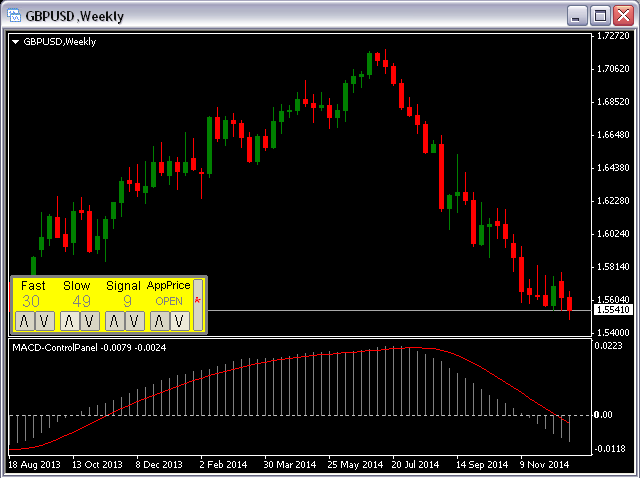
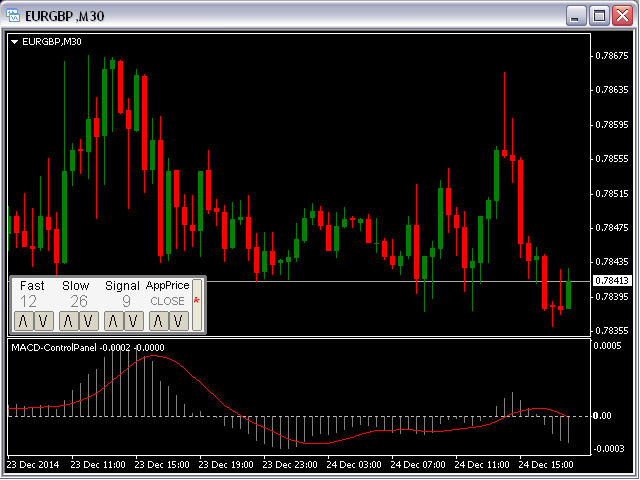
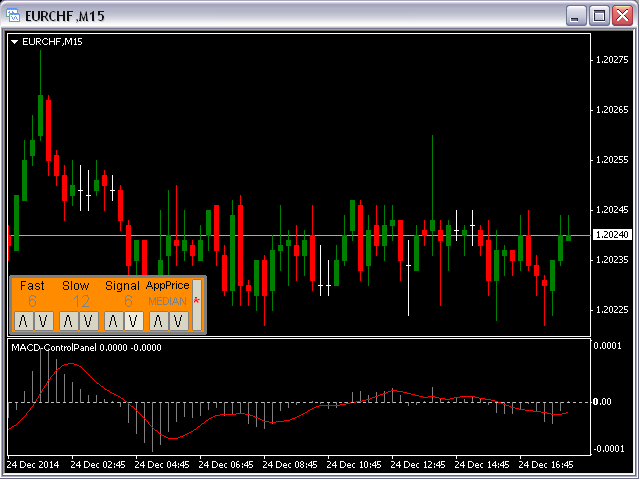
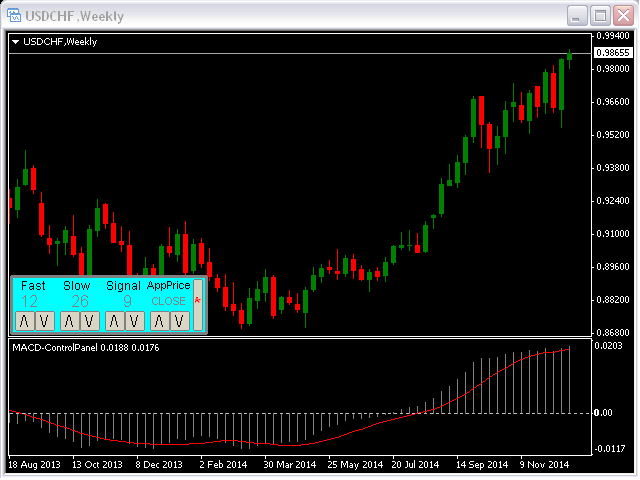
Este indicador será muy útil para la investigación de un sistema de estrategia comercial. El panel de control MACD está basado en el muy popular indicador Relative Strength Index.
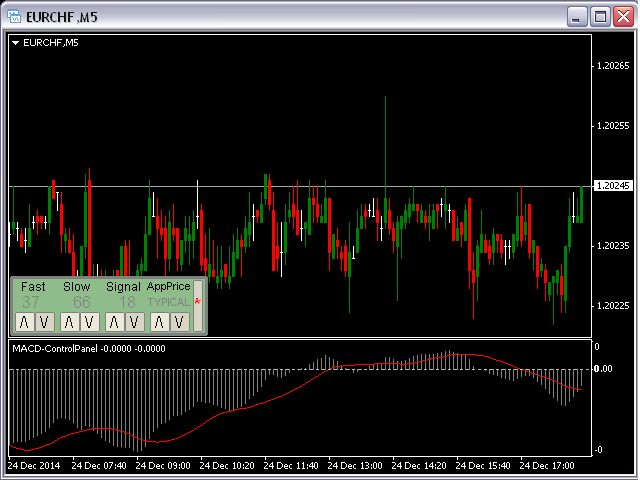
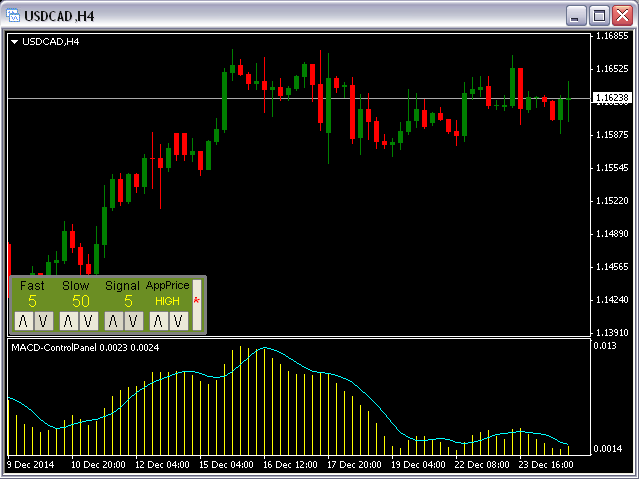
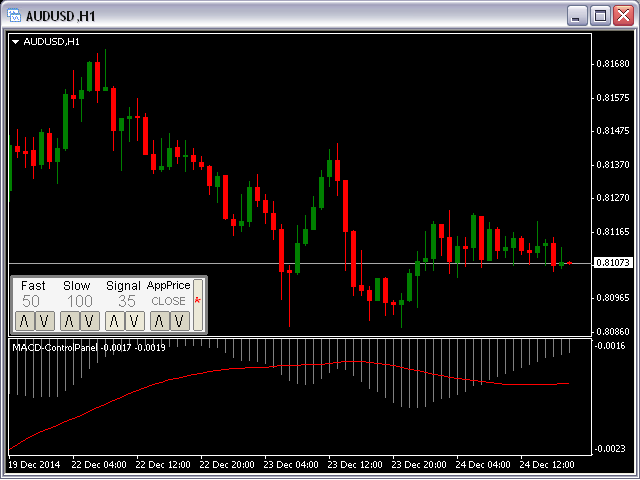
Podrá cambiar los parámetros del indicador FastPeriod, SlowPeriod, SignalPeriod y Apply Price haciendo clic en los botones Up ( /\ ) y Down ( \/ ).
A veces, al abrir un par de divisas o un marco temporal poco utilizado, el indicador no mostrará su valor. En este caso debe utilizar el botón"0".