MTF ZigZag MT4
- Indicadores
- Versión: 3.52
- Actualizado: 27 marzo 2020
- Activaciones: 5

El indicador Zig-Zag es extremadamente útil para determinar las tendencias de los precios, las zonas de soporte y resistencia, y los patrones gráficos clásicos como cabeza y hombros, doble fondo y doble techo.
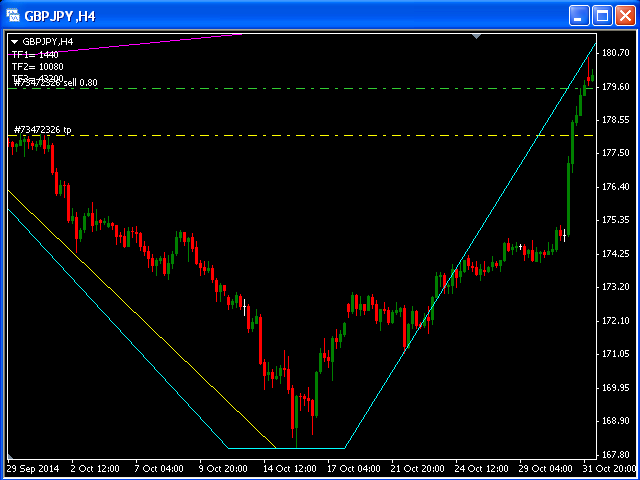
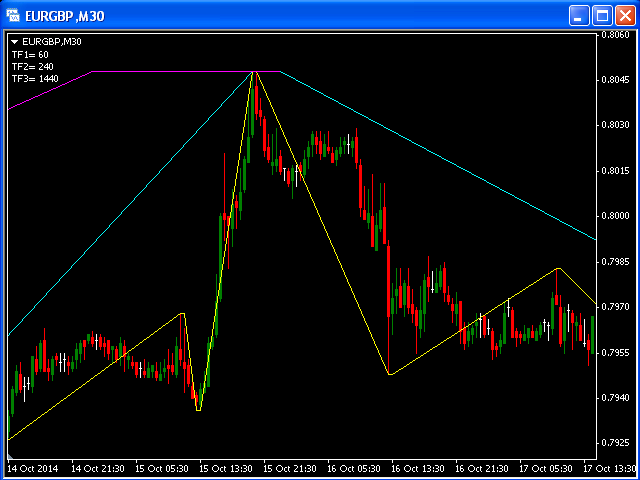
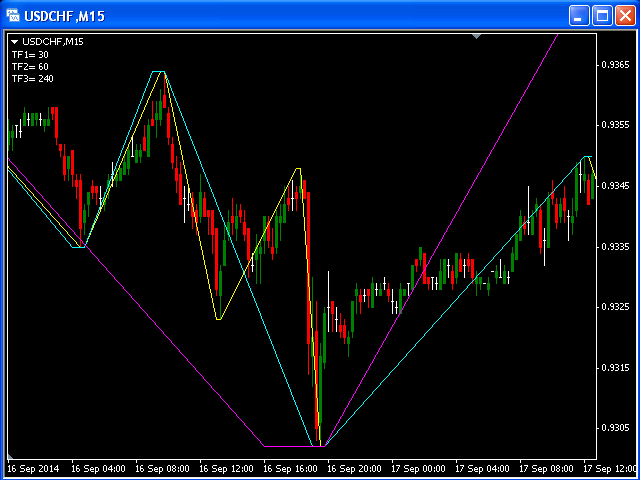
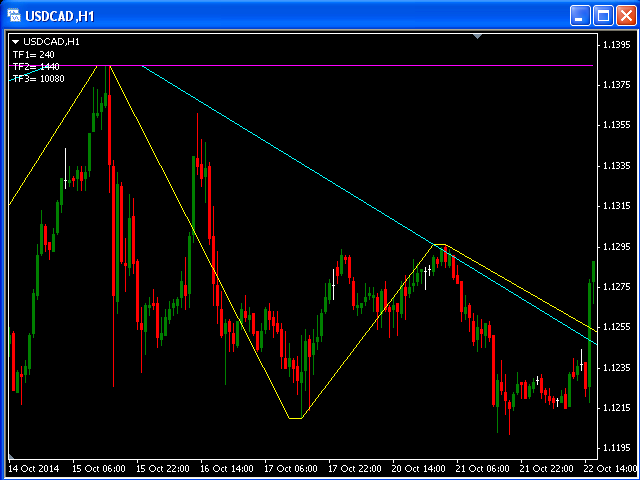
Este indicador es un indicador Multi Time Frame.
El indicador calcula automáticamente los 3 siguientes TF disponibles y siembra ZigZag desde esos TimeFrames.
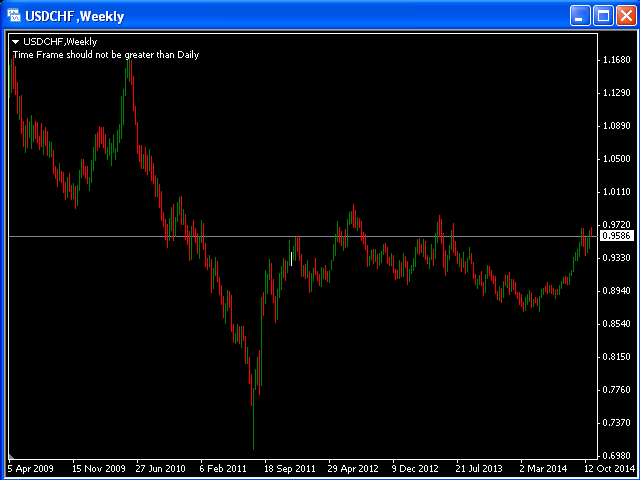
No puede utilizar este indicador para el TF mayor que D1 (diario).