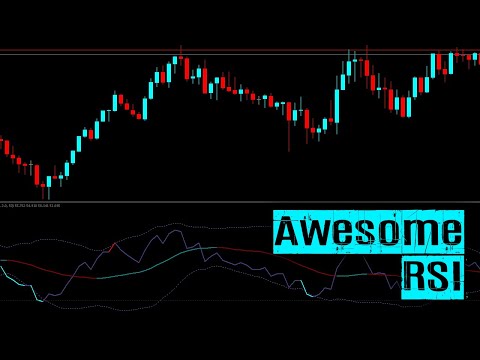
Awesome RSI
- Indicadores
-
Flavio Javier Jarabeck
 We are a closed brotherhood of traders whose ultimate goal is to profit through well-studied, structured, and automated trades. As a result, we publish dozens of MT5 indicators (FREE and paid) to the global MQL5 community. 80% of our published products are high-quality free indicators so beginner
 - Versión: 1.4
- Actualizado: 29 febrero 2024
- Activaciones: 20
El Índice de Fuerza Relativa presentado al mundo en 1978 por J. Welles Wilder Jr. en su libro"New Concepts in Technical Trading Systems" es ampliamente utilizado en todo el mundo de varias maneras, no sólo con el enfoque tradicional de los estados de Sobrecompra y Sobreventa, que en varios casos y dependiendo de los activos y marcos de tiempo simplemente ya no funciona.
PERO, este indicador tiene su valor cuando se usa, por ejemplo, buscando divergencias entre su sistema de medición y los Precios que aparecen en tu gráfico, entre muchos otros.
Y, como en Minions Labs estudiamos MUCHO, encontramos una simbiosis muy interesante entre el RSI y las Bandas de Bollinger, otro indicador muy conocido por los traders de todo el mundo.
Y SI...
Tomamos los datos del RSI y los inyectamos en las Bandas de Bollinger, así obtendremos una representación gráfica de los datos del RSI trazados como un indicador? ¿Así que de esta manera podemos tener una verdadera representación de los probables niveles dinámicos de Sobrecompra y Sobreventa en lugar del clásico 70/30?
BIENVENIDO AL IMPRESIONANTE RSI!
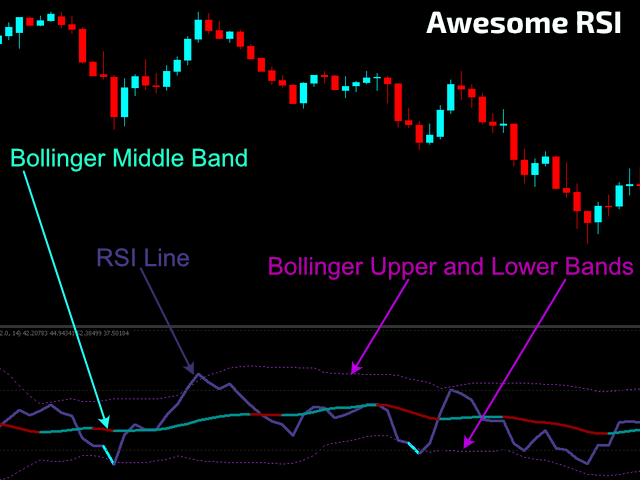
El Awesome RSI toma los valores de los datos del RSI y los utiliza en los cálculos de las Bandas de Bollinger, ¡así que las "Bandas" representan la volatilidad del RSI! Con este enfoque podemos mejorar las mediciones de los picos y la propia tendencia.
El indicador en sí ofrece una miríada de lecturas como puedes ver por ti mismo en el video y en las capturas de pantalla a continuación.
CÓMO "LEER" ESTE INDICADOR
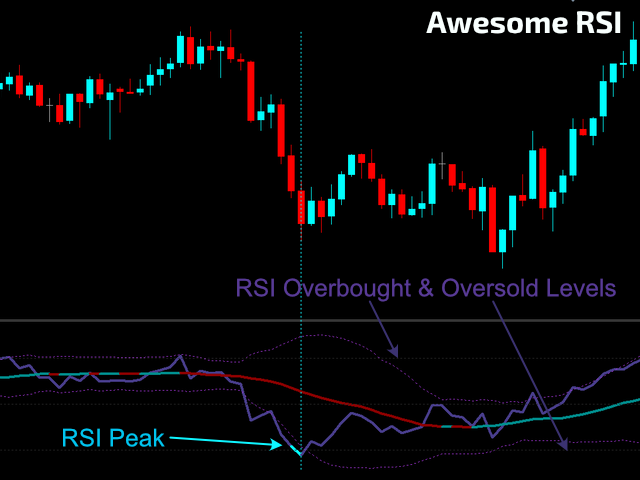
- Ahora los niveles de Sobrecompra y Sobreventa se pueden leer a través de las bandas Superior e Inferior de las Bandas de Bollinger. Para facilitar la lectura puede elegir entre 3 tipos de filtrado: cruce simple de Bandas, cruce de Bandas + RSI por encima/por debajo de los niveles de Sobrecompra y Sobreventa que desee, y cruce de Bandas + RSI y Bandas por encima/por debajo de los niveles de Sobrecompra y Sobreventa que desee.
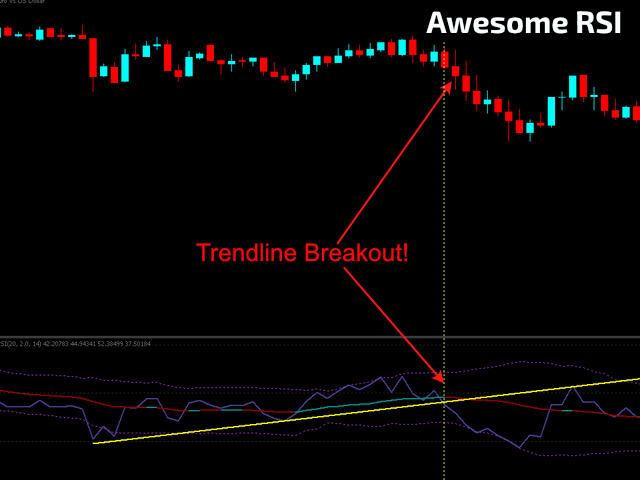
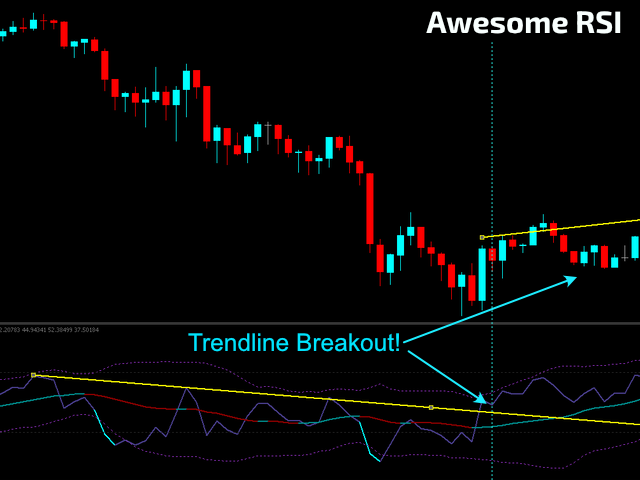
- Puede dibujar líneas de tendencia manuales sobre los picos y valles del indicador para supervisar las primeras rupturas de la tendencia actual.
- También puede dibujar o detectar visualmente divergencias entre los picos y valles del indicador y los precios de su gráfico.
- Puede controlar el cruce de la línea de la banda media para detectar cambios tempranos en la tendencia.
- Además, la banda media cambia de color cuando el mercado está en tendencia alcista o bajista.
- Usted puede ver y detectar RSI Squeezes.
- Todas las lecturas anteriores son posibles si CALIBRA este indicador apropiadamente a su Estilo de Operación / Activo / Marco de Tiempo.
AJUSTES
- Modo de Operación (Marcadores visuales):
- Cuando el RSI rompe las Bandas de Bollinger Superior e Inferior.
- Cuando el RSI rompe las bandas superior e inferior de Bollinger, Y, el RSI está por encima/debajo de los niveles de sobrecompra y sobreventa.
- Cuando el RSI rompe las bandas superior e inferior de Bollinger, Y, el RSI y las bandas superior/inferior están por encima/debajo de los niveles de sobrecompra y sobreventa.
- Periodo de las Bandas de Bollinger
- Factor de Desviación de las Bandas de Bollinger (desde la Línea Principal)
- Periodo RSI
- Tipo de Precio RSI a utilizar en los cálculos
- Nivel de sobrecompra del RSI (clásico=70)
- RSI Nivel de sobreventa (clásico=30)
- RSI Nivel medio (clásico=50)
- Colores para la línea de niveles en la subventana del indicador
- Sistema de Alertas: Puedes elegir alertas para los niveles de Sobrecompra y Sobreventa del RSI, enviadas directamente a tu e-Mail, a la pantalla de tu Gráfico o por la aplicación MT5 Mobile.
¿Quieres probarlo por ti mismo, en directo en tus activos? Descargue la versión DEMO aquí: Impresionante RSI DEMO
* Debido a la nueva política de MQL5 los desarrolladores ya no pueden proporcionar versiones DEMO al público en general aquí en este sitio web.
Buffers para usar en tu EA:
- #0 - Datos RSI
- #1 - RSI Color: 0-RSI dentro de las Bandas / 1-Fuera de la Banda Superior / 2-Fuera de la Banda Inferior
- #2 - Banda Media de Bollinger
- #3 - Color de la Banda Media de Bollinger: 0-Tendencia alcista / 1-Tendencia bajista
- #4 - Datos de la Banda Superior
- #5 - Datos de la Banda Inferior
¿No ha encontrado la función que necesita?
Ningún producto es perfecto para todo el mundo. Si usted piensa que necesita una característica que falta de nuestro producto sólo envíenos un mensaje. Nos encantan los comentarios.


RSI zusammen mit Bollinger Bands, eine sehr gute Idee Flavio!!! Ein Indikator den ich ständig benutze, der sehr hilfreich ist. Sehr gute Arbeit, danke.