Force Numbers
- Indicadores
-
Flavio Javier Jarabeck
 We are a closed brotherhood of traders whose ultimate goal is to profit through well-studied, structured, and automated trades. As a result, we publish dozens of MT5 indicators (FREE and paid) to the global MQL5 community. 80% of our published products are high-quality free indicators so beginner
 - Versión: 1.3
- Actualizado: 6 junio 2020
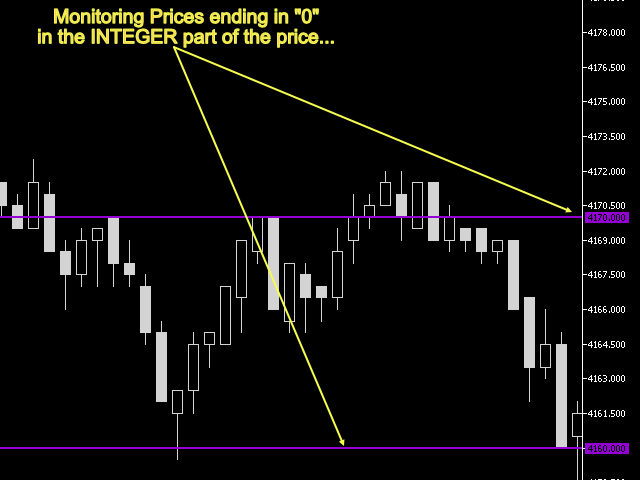
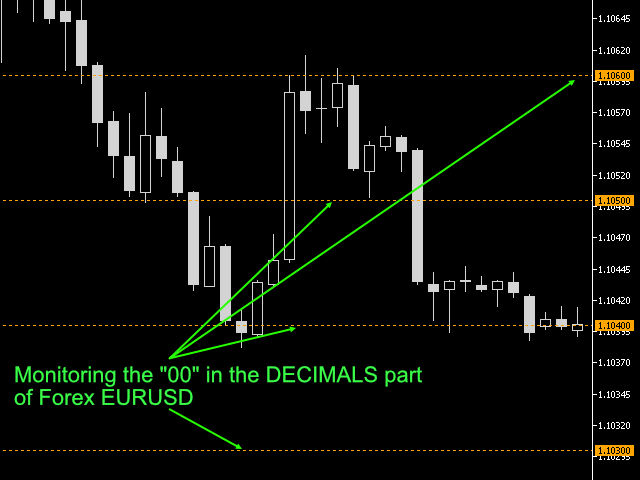
Varios activos en varios mercados tienen el comportamiento de usar números específicos como Números de Fuerza, donde se crea el soporte, la resistencia y el empuje del precio. Deje que este indicador dibuje esos niveles de soporte y resistencia para usted. ¡También puede apilarlo para mostrar diferentes niveles de Precios! Esta técnica está siendo utilizada por Lectores de Cintas y operadores de Flujo de Órdenes en todo el mundo desde hace mucho tiempo. Inténtelo. ¡Rétese a estudiar nuevas formas de Acción del Precio!
AJUSTES
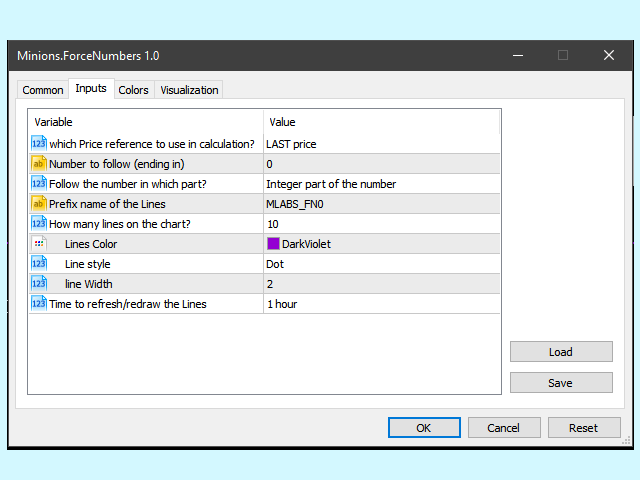
- Qué referencia de precio utilizar en el cálculo: ÚLTIMO precio o precio BID/ASK. En el caso de los Brokers de Forex que no proporcionan el precio LAST, puede utilizar el precio BID/ASK para escanear y dibujar las líneas de Soporte/Resistencia.
- Número a Seguir - ¿Quiere seguir números redondos terminados en "0", o "00"? ¿Quiere seguir precios de rango medio donde posiblemente el empuje comenzará como el "5" o el "7"? Configúrelo y olvídese.
- ¿Qué parte del número quiere controlar? ¿La parte INTEGRA o la DECIMAL ? De esta manera puede utilizar este indicador en todo el mundo, en cualquier tipo de escala de precios.
- Nombre del Prefijo para las Líneas - De esta manera usted puede tener un Asesor Experto que siga esas líneas y tome acción sobre ellas.
- Cuántas Líneas quiere que se impriman en su gráfico.
- Estilos de Líneas: Color, estilo y ancho.
- Tiempo para refrescar/redibujar las líneas, tomando nuevos niveles si es necesario, de acuerdo al Precio actual del mercado. De esta manera, si estás ejecutando una plataforma MT5 continuamente con un EA, no tienes que reiniciar el indicador en la búsqueda de nuevas Líneas/Niveles de Precio.
Si te gusta este indicador, todo lo que estoy pidiendo es un poco de revisión (no un comentario, pero una revisión!) ...
Esto significará MUCHO para mí... Y de esta manera puedo seguir regalando cosas interesantes de forma gratuita ...
¡Sin ataduras! ¡Nunca!
¡Larga Vida y Prosperidad!
;)


Good...