VWAP and MVWAP
- Indicadores
-
Flavio Javier Jarabeck
 We are a closed brotherhood of traders whose ultimate goal is to profit through well-studied, structured, and automated trades. As a result, we publish dozens of MT5 indicators (FREE and paid) to the global MQL5 community. 80% of our published products are high-quality free indicators so beginner
 - Versión: 1.1
- Actualizado: 6 junio 2020
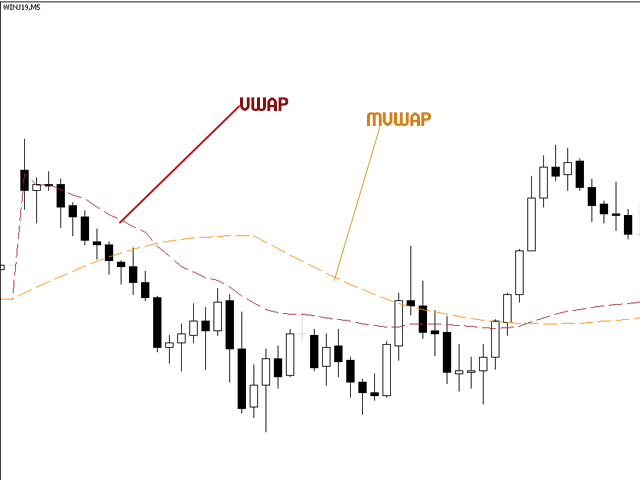
El precio medio ponderado por volumen (VWAP) es una referencia de negociación utilizada habitualmente por los grandes operadores que indica el precio medio al que se ha negociado un símbolo a lo largo del día. Se basa tanto en el volumen como en el precio. Adicionalmente ponemos en este indicador el MVWAP (Moving Volume Weighted Average Price).
Para aquellos que no conocen el uso y la importancia de este indicador recomiendo un gran artículo sobre este tema en Investopedia(https://www.investopedia.com/articles/trading/11/trading-with-vwap-mvwap.asp). No recomendamos operar únicamente con este indicador. Utilícelo como una herramienta más en su caja de herramientas para confirmar el comportamiento del precio y del mercado.
El indicador VWAP está diseñado para ser utilizado en Day Trades, ya que su periodo de cálculo es DIARIO (periodo de 1 día).
El MVWAP se puede utilizar en plazos más largos (es decir, diarios)...
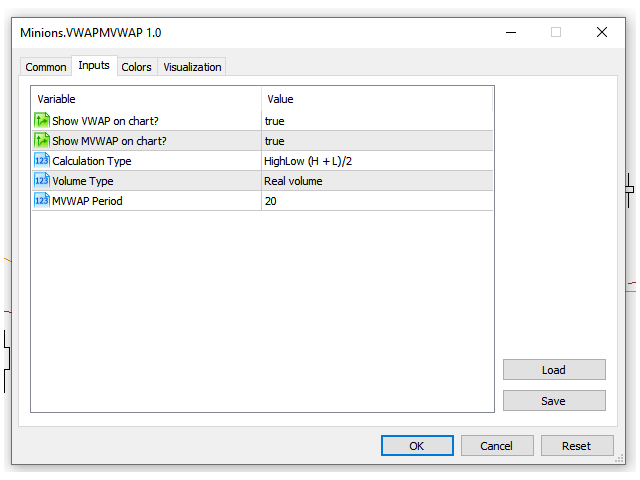
AJUSTES
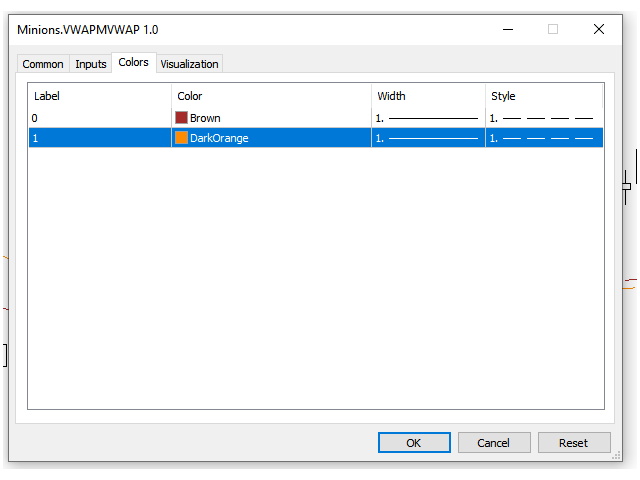
- Posibilidad de mostrar/ocultar la línea VWAP en el gráfico.
- Posibilidad de mostrar/ocultar la línea MVWAP en el gráfico.
- Elija el tipo de cálculo de la línea VWAP.
- Tipo de Volumen utilizado (Ticks o Real)
- Periodo de la línea MVWAP.
Looking for more FREE VWAP-related indicators, here you go:
Si te gusta este indicador, todo lo que estoy pidiendo es un poco de revisión (no un comentario, pero una revisión!) ...
Esto significará MUCHO para mí... Y de esta manera puedo seguir regalando cosas interesantes de forma gratuita ...
¡Sin ataduras! ¡Nunca!
¡Larga Vida y Prosperidad!
;)


Great one ! Thank you