HVK Auto MIDAS
- Indicadores
- Versión: 3.0
- Actualizado: 20 noviembre 2022
- Activaciones: 5

Posicionamiento automático de MIDAS, el indicador permite la colocación de dos MIDAS, cada una tiene 3 líneas que pueden ser calculadas usando precios de Apertura/Altura/Media/Típica o Ponderada, usted puede fijar cada MIDAS a las barras de Apertura/Altura/Media o Cierre de cualquier día, incluyendo el día actual, una vez fijada, si el precio de esta barra cambia o usted cambia el marco de tiempo, el indicador hará el reposicionamiento y recálculo.
También puede hacer un reposicionamiento manual de las dos MIDAS moviendo su etiqueta de inicio.
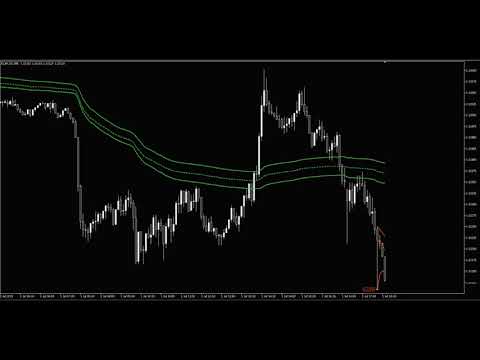
It is always risky being the first person to buy an indicator. I played with this thing for hours and got nowhere. It has 4 "modes" but with no instructions. I already own a MIDAS indicator and it works ok IF you can find the starting point, but because this is on MT5, I have no way of comparing. with two sets of lines (red and green) it can overwhelm the chart with lines crossing and gets confusing. I really dont know what it does, but thought it would work similar to the one I own. I give it 1.5 stars, but 3 because of the price...I am using this on the MetaQuotes MT5 available for free. My MT4 is FXChoice, but obviously i cannot use it on there. UPDATE 11-21-22. The Vendor has attempted to make changes. There is no doubt he is trying to solve this and one can tell he put a lot of work into the indicator. By faith, I will continue to figure it out and make it work. One star added. Again, the price was fair, although five activations is absurd for any Vendor. 10 should be minimum.