TD Combo Metrader 5
- Indicadores
- Versión: 1.2
- Activaciones: 20

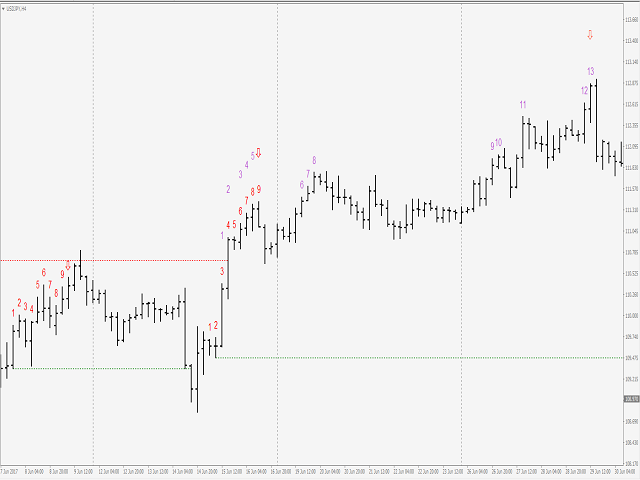
TD Combo es mejor cuando hay movimientos direccionales bruscos, porque sólo requiere trece barras de precios desde el principio hasta el final, en comparación con TD Sequential, que necesita al menos 22 barras. Los criterios para un Setup dentro de TD Combo son los mismos que los requeridos para un Setup dentro de TD Sequential. La diferencia es que el recuento comienza en la barra 1 del setup y no desde la barra 9 y TD Combo requiere que se cumplan cuatro condiciones simultáneamente.
Requisitos para un TD Combo Buy Countdown
Requisitos para un TD Combo Buy Countdown
- Cierre inferior o igual al mínimo de 2 días de negociación anteriores.
- El mínimo de un día de cuenta atrás debe ser inferior al mínimo del "día de negociación" anterior
- El cierre de un día de cuenta atrás debe ser inferior al cierre del "día de negociación" anterior
- El cierre de un día de cuenta atrás debe ser inferior al cierre del "día de cuenta atrás" anterior
- Cada una de las barras 11,12,13 debe cerrar sucesivamente a la baja y no se aplican las demás reglas anteriores.
** TD Combo Sell es lo contrario de lo anterior
Para TD Combo Scanner MT5; por favor visite ► https://www.mql5.com/en/market/product/59019
Para Mis Otros Productos; por favor visite ► https://www.mql5.com/en/users/samil34/seller