Aroon Global
- Indicadores
- Versión: 1.23
- Actualizado: 23 julio 2024
- Activaciones: 7

Descripción
Un indicador de color multidivisa/multisímbolo Aroon Global basado en uno de los veintitrés indicadores estándar de MT4. El indicador consta de dos líneas: Aroon Up y Aroon Down.
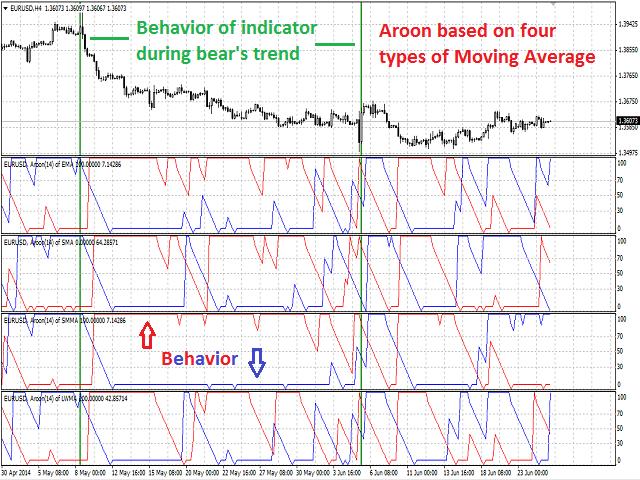
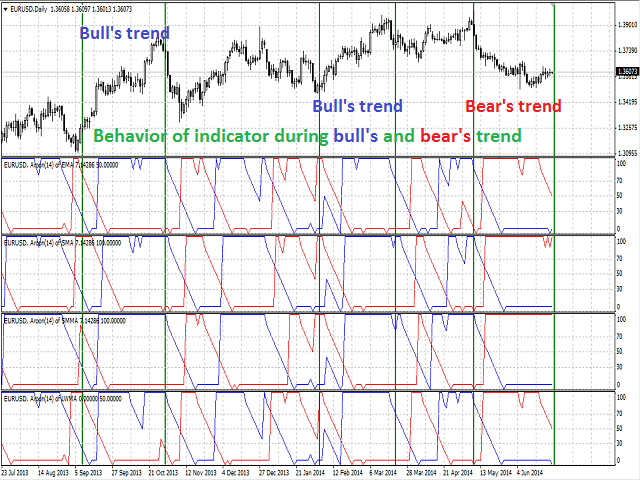
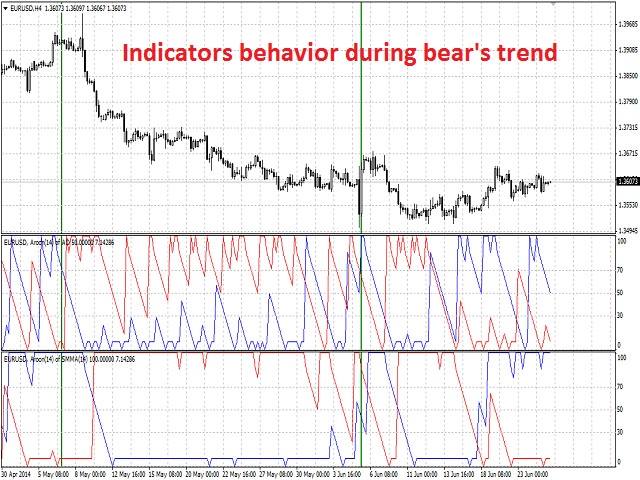
La función principal del indicador es predecir el cambio de tendencia.
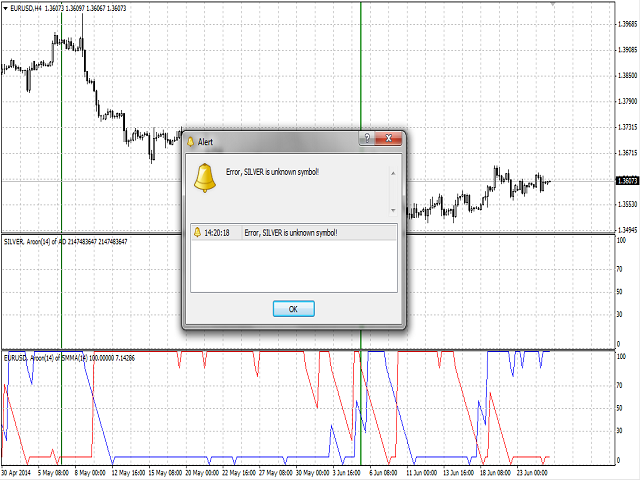
El indicador puede utilizarse con cualquier broker, independientemente del nombre del instrumento financiero, ya que es necesario introducir manualmente el nombre como parámetro de entrada. Si introduce un nombre inexistente o incorrecto de un instrumento financiero, recibirá un mensaje de error que indica que este instrumento financiero es desconocido (no existe).
Las líneas del indicador pueden colorearse.
Finalidad
El indicador se puede utilizar para el comercio manual o automatizado en un Asesor Experto. Los valores de la memoria intermedia del indicador de tipo doble se pueden utilizar para el comercio automatizado:
- La línea alcista del indicador Aroon Up - buffer 0.
- La línea bajista del indicador Aroon Down - buffer 1.
Significado de las señales del indicador
El indicador puede tener múltiples estados dependiendo de la disposición mutua de sus líneas - Aroon Up y Aroon Down:
- Cuando las líneas alcanzan los extremos.
- Cuando las líneas se mantienen en determinados rangos.
- Cuando hay un movimiento paralelo de Aroon Up y Aroon Down.
- Cruce de Aroon Up y Aroon Down.
Así que
- Extremos y líneas en ciertos rangos:
- Cuando Aroon Up alcanza 100, esto puede significar el fortalecimiento del mercado.
- Si Aroon Up se mantiene persistentemente entre 70 y 100, se espera una nueva tendencia alcista.
- Del mismo modo, si Aroon Up llega a cero, se espera un debilitamiento del mercado.
- Si Aroon Up se sitúa entre 0 y 30, se espera una nueva tendencia bajista.
- Se observa una fuerte tendencia bajista cuando Aroon Up se mantiene persistentemente entre 0 y 30, mientras que Aroon Down se mantiene persistentemente entre 70 y 100.
- Movimiento paralelo de Aroon Up y Aroon Down:
- Si las líneas son paralelas y cercanas entre sí, cabe esperar un mayor fortalecimiento de la tendencia.
- Intersección de las líneas:
- Cuando Aroon Down cruza Aroon Up desde abajo hacia arriba, se detecta un debilitamiento del mercado y cabe esperar un descenso de los precios.
- Cuando Aroon Up cruza Aroon Down desde abajo hacia arriba, se detecta un posible fortalecimiento del mercado y cabe esperar un crecimiento de los precios.
La señal más fiable es la recibida en el intervalo D1 en comparación con, por ejemplo, el intervalo H1.
Entradas
- Currency_Name - el nombre del instrumento financiero.
- Calc_Method - el índice del indicador, en base al cual se calculará el indicador Aroon:
- 0 - AD (acumulación y distribución de volumen) - (por defecto).
- 1 - OBV (volumen en balance).
- 2 - Volume (volumen de ticks).
- 3 - AC (Acelerador/Decelerador).
- 4 - AO (Awesome Oscillator).
- 5 - BullsPower.
- 6 - BearsPower.
- 7 - BullsPower - BearsPower.
- 8 - Force (Índice de Fuerza).
- 9 - MFI (Índice de Flujo Monetario).
- 10 - BW MFI (Índice de Facilitación del Mercado).
- 11 - ATR (Average True Range).
- 12 - Momentum.
- 13 - RSI (Índice de Fuerza Relativa).
- 14 - RVI (Índice de Vigor Relativo).
- 15 - MA (Media móvil)
- 16 - CCI (Índice del Canal de Materias Primas).
- 17 - ADX (Media Direccional).
- 18 - DeMarker.
- 19 - Desviación estándar.
- 20 - OsMA (Oscilador de Medias Móviles).
- 21 - MACD (Divergencia de Convergencia de Medias Móviles).
- 22 - Estocástico.
- 23 - %R (Oscilador Williams %).
- Ind_period - período de cálculo del indicador.
- KPeriod - K período de estocástico.
- DPeriod - D período de estocástico.
- Slowing - Período de desaceleración del estocástico.
- Stoch_Price - Tipo de precio para estocástico:
- Bajo/Alto (por defecto).
- Cierre/Close.
- Price_Field - método de promediación para Estocástico:
- Simple.
- Exponencial (por defecto).
- Suavizado.
- Lineal ponderado.
- FastPeriod - el periodo MA rápido del indicador básico MACD u OsMA.
- SlowPeriod - el periodo MA lento del indicador básico MACD u OsMA.
- SignalPeriod - el período de la línea de señal del indicador básico MACD u OsMA.
- MA_Method - método de promediación para la MA del indicador básico:
- Simple.
- Exponencial (por defecto).
- Suavizado.
- Lineal ponderado.
- Applied_Price - el precio utilizado del indicador básico:
- Precio de cierre (por defecto).
- Precio de apertura.
- Precio alto.
- Precio mínimo.
- Precio medio.
- Precio típico.
- Precio ponderado.
- Modo - el índice de la línea (MAIN - 0 (por defecto) o SIGNAL - 1) del indicador básico, en base al cual se calculará el ADX, RVI, Estocástico o MACD.
- Shift - el desplazamiento del indicador básico con respecto al gráfico de precios.
Recomendaciones
El indicador se puede utilizar junto con el indicador de precios Aroon.