Aroon Global
- 지표
- 버전: 1.23
- 업데이트됨: 23 7월 2024
- 활성화: 7

Description
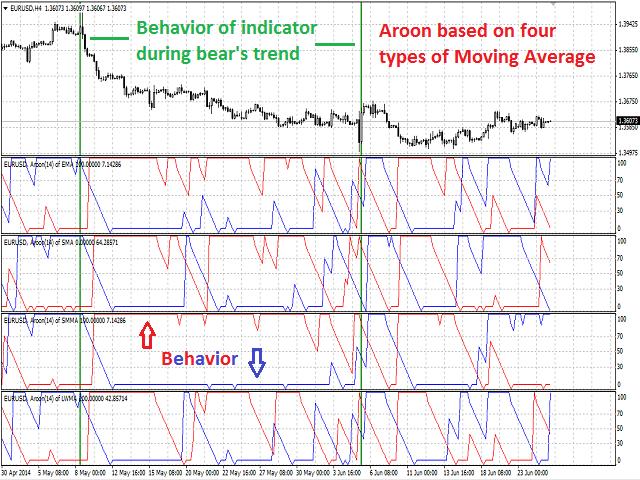
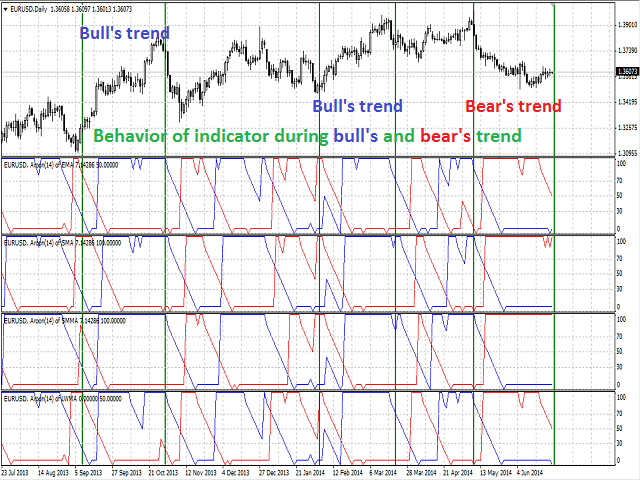
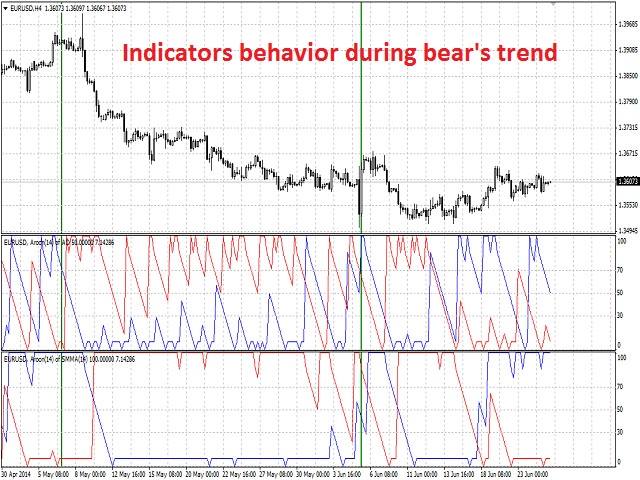
A colored multicurrency/multisymbol indicator Aroon Global based on one of the twenty three standard indicators of MT4. The indicator consists of two lines: Aroon Up and Aroon Down.
The main function of the indicator is to predict the trend change.
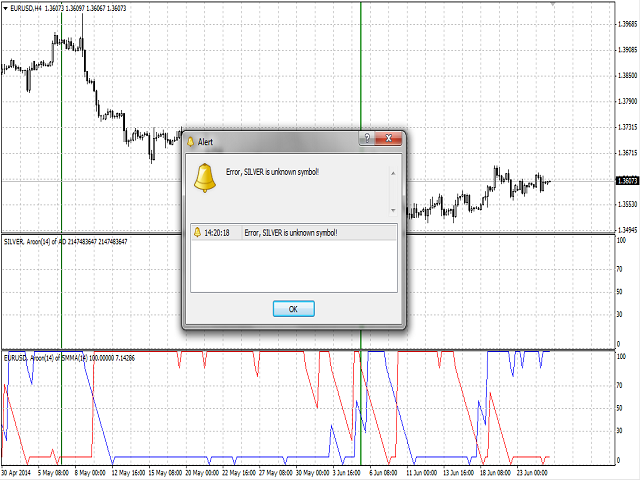
The indicator may be used with any broker, irrespective of the name of the financial instrument since it is necessary to manually enter the name as an input parameter. If you enter a non-existent or incorrect name of a financial instrument, you will receive an error message that this financial instrument is unknown (does not exist).
The indicator lines can be colored.
Purpose
The indicator can be used for manual or automated trading in an Expert Advisor. Values of indicator buffer of the double type can be used for automated trading:
- The bullish line of the indicator Aroon Up - buffer 0.
- The bearish line of the indicator Aroon Down - buffer 1.
Meaning of the Indicator Signals
The indicator may have multiple states depending on the mutual arrangement of its lines - Aroon Up and Aroon Down:
- When the lines reach extremes.
- When the lines stay in certain ranges.
- When there is a parallel movement of Aroon Up and Aroon Down.
- Crossing of Aroon Up and Aroon Down.
So
- Extremes and lines in certain ranges:
- When Aroon Up reaches 100, this may mean strengthening of the market.
- If Aroon Up persistently stays between 70 and 100, a new uptrend is expected.
- Similarly, if Aroon Up reaches zero, weakening of the market is expected.
- If Aroon Up is between 0 and 30, a new downtrend is expected.
- A strong downtrend is observed when Aroon Up persistently stays between 0 and 30, while Aroon Down persistently stays between 70 and 100.
- Parallel movement of Aroon Up and Aroon Down:
- If the lines are parallel and close to each other, further strengthening of the trend can be expected.
- Intersection of the Lines:
- When Aroon Down crosses Aroon Up from bottom upwards, market weakening is detected and price decrease should be expected.
- When Aroon Up crosses Aroon Down from bottom upwards, potential market strengthening and price growth is expected.
The most reliable is the signal received on D1 interval compared to, for example, H1 interval.
Inputs
- Currency_Name - the name of the financial instrument.
- Calc_Method - the index of the indicator, based on which the Aroon indicator will be calculated:
- 0 - AD (accumulation and distribution of volume) - (by default).
- 1 - OBV (On Balance Volume).
- 2 - Volume (tick volume).
- 3 - AC (Accelerator/Decelerator).
- 4 - AO (Awesome Oscillator).
- 5 - BullsPower.
- 6 - BearsPower.
- 7 - BullsPower - BearsPower.
- 8 - Force (Force Index).
- 9 - MFI (Money Flow Index).
- 10 - BW MFI (Market Facilitation Index).
- 11 - ATR (Average True Range).
- 12 - Momentum.
- 13 - RSI (Relative Strength Index).
- 14 - RVI (Relative Vigor Index).
- 15 - MA (Moving Average)
- 16 - CCI (Commodity Channel Index).
- 17 - ADX (Average Directional Movement).
- 18 - DeMarker.
- 19 - Standard Deviation.
- 20 - OsMA (Oscillator of Moving Averages).
- 21 - MACD (Moving Average Convergence Divergence).
- 22 - Stochastic.
- 23 - %R (Williams % Oscillator).
- Ind_period - indicator calculation period.
- KPeriod - K period of Stochastic.
- DPeriod - D period of Stochastic.
- Slowing - Slowing period of Stochastic.
- Stoch_Price - type of price for Stochastic:
- Low/High (by default).
- Close/Close.
- Price_Field - averaging method for Stochastic:
- Simple.
- Exponential (by default).
- Smoothed.
- Linear weighted.
- FastPeriod - the fast MA period of the basic indicator MACD or OsMA.
- SlowPeriod - the slow MA period of the basic indicator MACD or OsMA.
- SignalPeriod - the signal line period of the basic indicator MACD or OsMA.
- MA_Method - averaging method for the MA of the basic indicator:
- Simple.
- Exponential (by default).
- Smoothed.
- Linear weighted.
- Applied_Price - the used price of the basic indicator:
- Close price (by default).
- Open price.
- High price.
- Low price.
- Median price.
- Typical price.
- Weighted price.
- Mode - the index of the line (MAIN - 0 (by default) or SIGNAL - 1) of the basic indicator, based on which ADX, RVI, Stochastic or MACD will be calculated.
- Shift - the sift o the basic indicator relative to the price chart.
Recommendations
The indicator can be used together with the price indicator Aroon.