Fibo Bands
- Indicadores
- Versión: 1.22
- Actualizado: 25 julio 2024
- Activaciones: 7

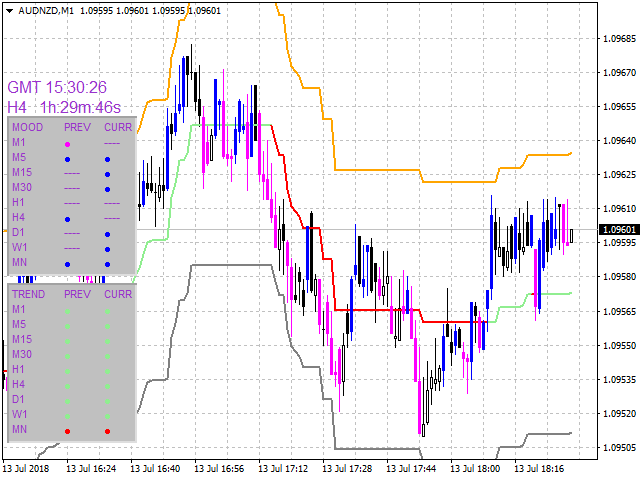
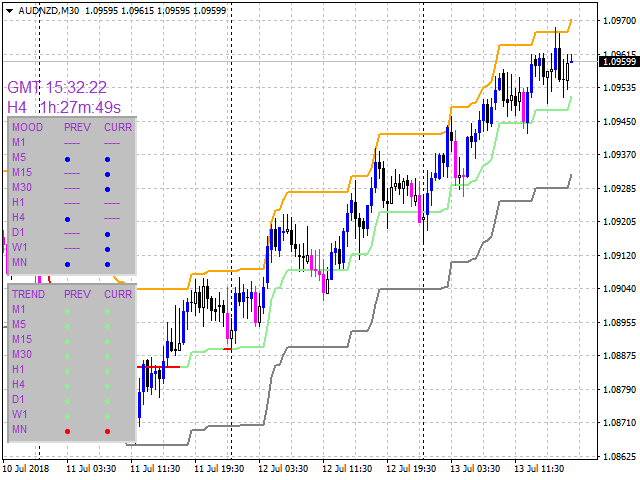
Fibo Bands es un indicador innovador y un analizador para operar en la dirección de la tendencia actual. El indicador construye un canal de Fibonacci (bandas), y consta de una línea de tendencia (línea media), bandas de canal, barras de colores e información de referencia.
Una vez finalizada la barra actual, la línea de tendencia, el canal y el color de la barra no se vuelven a dibujar. Sin embargo, la anchura del canal puede modificarse tras un reinicio o reinicio del indicador en función de la volatilidad.
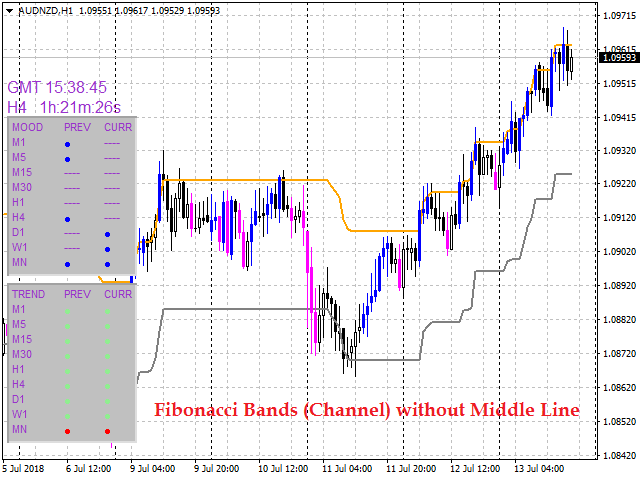
El canal se construye de acuerdo con la expansión de Fibonacci, que puede establecerse individualmente para cada marco temporal. Los bordes del canal pueden servir como objetivo de toma de beneficios.
El cambio del sentimiento del mercado puede calcularse basándose en uno de los catorce indicadores básicos incluidos en el paquete estándar de MT4, afecta al color de la línea de tendencia.
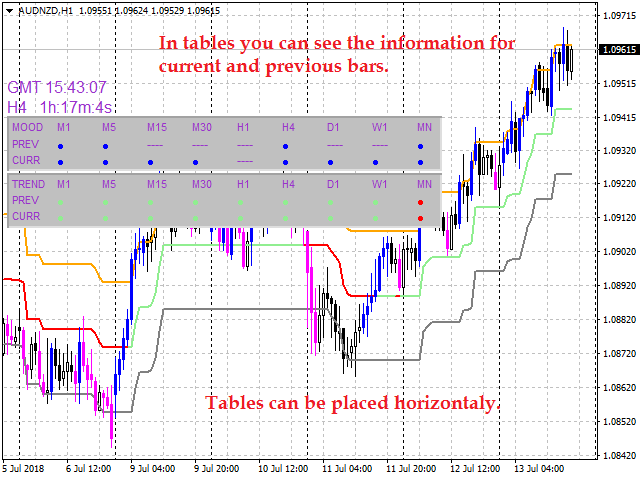
Las tablas de información de referencia contienen datos sobre el color de las barras y la línea media de las dos últimas barras en todos los marcos temporales. Los colores de las barras y la línea media caracterizan el estado de ánimo del mercado.
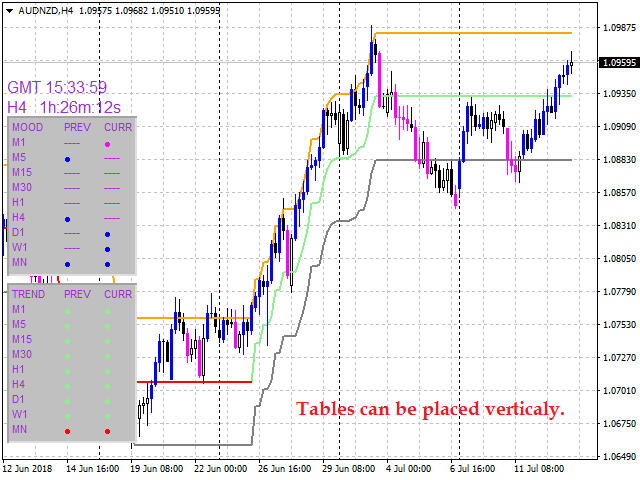
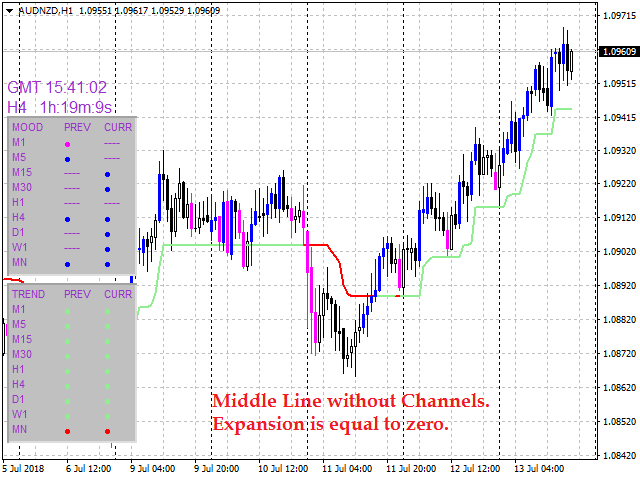
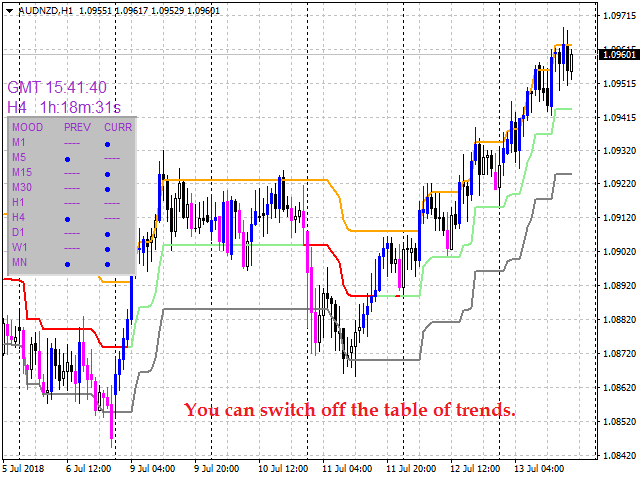
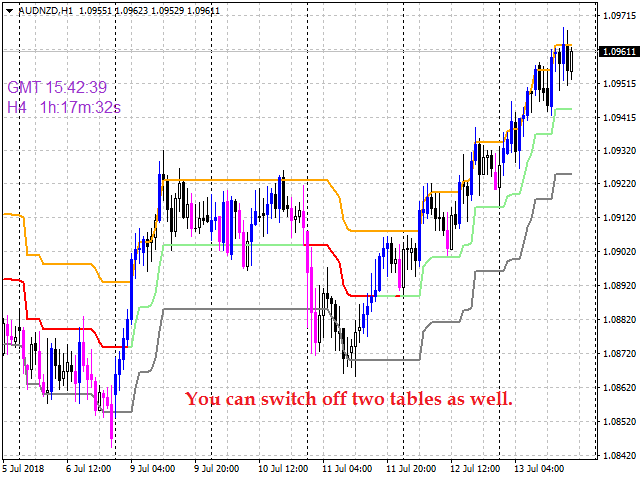
Opcionalmente, las barras de colores, la línea media, las bandas y la información de referencia pueden mostrarse en el gráfico u ocultarse, como se muestra en las capturas de pantalla.
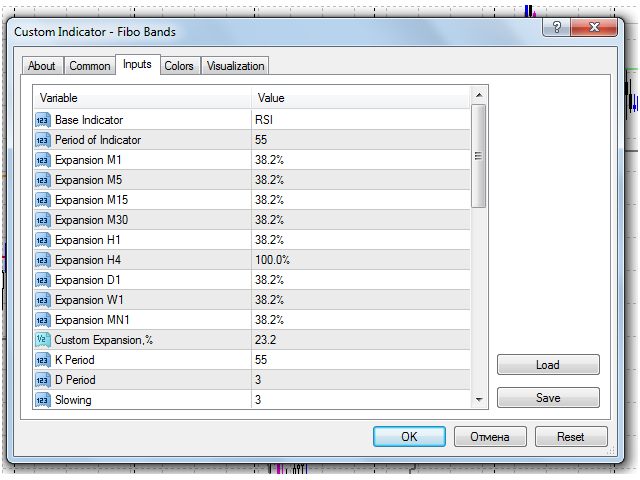
Parámetros de entrada
- IndicadorBase - el indicador básico utilizado;
- Período del Indicador - período de cálculo para el indicador básico;
- Expansión M1... MN1 - ajustes de expansión de Fibonacci para diferentes marcos temporales;
- ExpansiónPersonalizada,% - valor de expansión personalizado;
- K Period - Parámetros estocásticos;
- Período D - Parámetros estocásticos;
- Ralentización - Parámetros estocásticos;
- Tipo de Precio Estocástico - Precio de cálculo estocástico;
- Price Field - método de promediación para la línea de señal estocástica;
- MA Fast Period - período de media móvil rápida para el indicador básico;
- MA Slow Period - período de media móvil lenta para el indicador básico;
- MA Signal Period - período de la línea de señal para el indicador básico;
- Precio Aplicado - precio utilizado para el cálculo del indicador básico;
- Método MA - método de promediación de la media móvil del indicador básico;
- Línea Modo - índice de la línea del indicador básico;
- Candlesticks Painting - coloración de las barras;
- Tipo de Esquina - la esquina del gráfico para mostrar información;
- Corner X Distance - coordenada de la tabla a lo largo del eje X en píxeles;
- Distancia Esquina Y - coordenada de la tabla a lo largo del eje Y en píxeles;
- Dibujo de la línea media - mostrar la línea media;
- GMT - muestra el valor actual de la hora GMT;
- Tiempo de la Próxima Barra H 4 - tiempo restante hasta la finalización de la barra H4;
- Tablapara Escaneode Velas - esta tabla escanea el color de las barras;
- Table for Middle Line Scanning - esta tabla escanea los colores de la línea media;
- Tabla Vertical - el método de visualización de la tabla;
- Color de la Información - color de la información;
- Bullish Color of Candlesticks - color de las barras alcistas;
- Bearish Color of Candlesticks - color de las barras bajistas;
- Bullish Color of Middle Line - color bajista para la línea media;
- Bearish Color of Middle Line - color alcista de la línea media.
Propósito
El indicador puede ser utilizado para el comercio manual o automatizado dentro de un Asesor Experto. Los valores de los buffers del indicador de tipo doble se pueden utilizar para el trading automatizado:
- La línea media de la tendencia alcista - buffer 0;
- La línea media de la tendencia bajista - buffer 1;
- Borde superior del canal - buffer 2;
- Borde inferior del canal - buffer 3;
- Coloración de la barra - cualquiera de los buffers 4, 5, 6 o 7.
Los búferes de los indicadores no deben ser iguales a EMPTY_VALUE.


Nice product if you learn how to use it. Congrats to author.