Aroon Global
- Indikatoren
- Version: 1.23
- Aktualisiert: 23 Juli 2024
- Aktivierungen: 7

Beschreibung
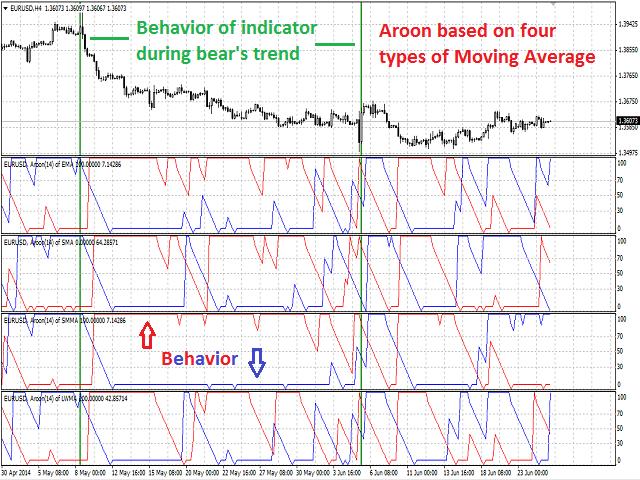
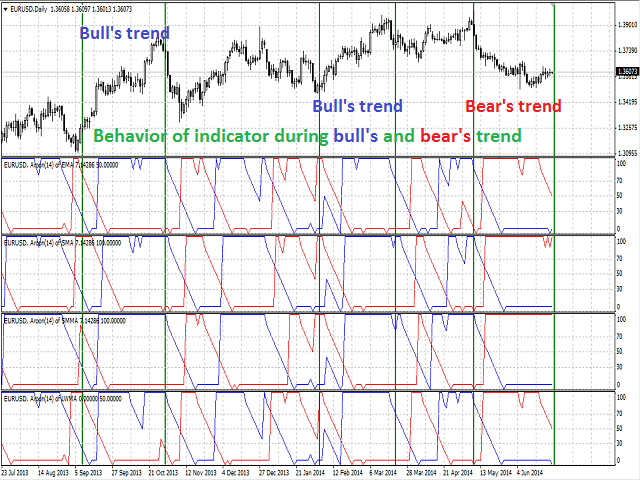
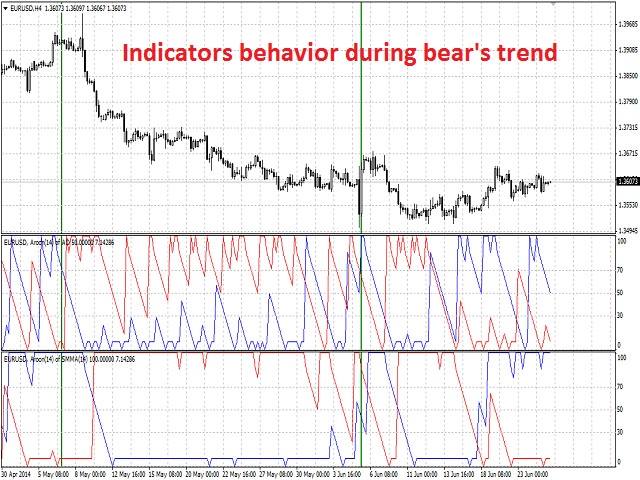
Ein farbiger Multicurrency/Multisymbol-Indikator Aroon Global , der auf einem der dreiundzwanzig Standardindikatoren von MT4 basiert. Der Indikator besteht aus zwei Linien: Aroon Up und Aroon Down.
Die Hauptfunktion des Indikators ist die Vorhersage des Trendwechsels.
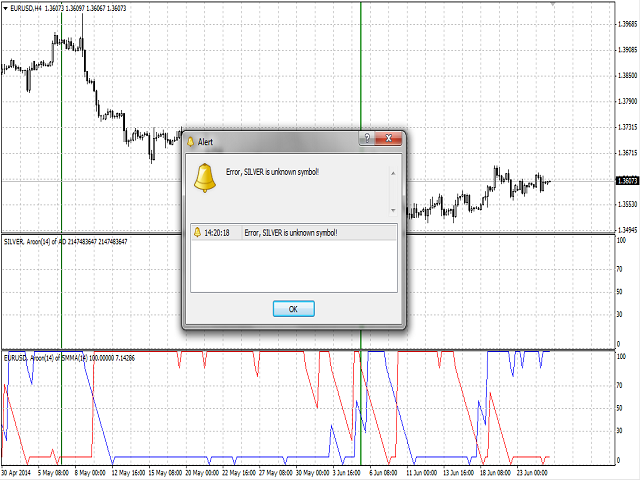
Der Indikator kann mit jedem Broker verwendet werden, unabhängig von der Bezeichnung des Finanzinstruments, da es notwendig ist, die Bezeichnung manuell als Eingabeparameter einzugeben. Wenn Sie einen nicht existierenden oder falschen Namen eines Finanzinstruments eingeben, erhalten Sie eine Fehlermeldung, dass dieses Finanzinstrument unbekannt ist (nicht existiert).
Die Indikatorzeilen können eingefärbt werden.
Zweck
Der Indikator kann für den manuellen oder automatisierten Handel in einem Expert Advisor verwendet werden. Die Werte des Indikatorpuffers vom Typ Double können für den automatisierten Handel verwendet werden:
- Die bullische Linie des Indikators Aroon Up - Puffer 0.
- Die Baisse-Linie des Indikators Aroon Down - Puffer 1.
Bedeutung der Indikatorsignale
Der Indikator kann mehrere Zustände haben, die von der gegenseitigen Anordnung seiner Linien abhängen - Aroon Up und Aroon Down:
- Wenn die Linien die Extrema erreichen.
- Wenn die Linien in bestimmten Bereichen bleiben.
- Wenn es eine parallele Bewegung von Aroon Up und Aroon Down gibt.
- Kreuzung von Aroon Up und Aroon Down.
Also
- Extrema und Linien in bestimmten Bereichen:
- Wenn der Aroon Up 100 erreicht, kann dies eine Stärkung des Marktes bedeuten.
- Bleibt Aroon Up dauerhaft zwischen 70 und 100, wird ein neuer Aufwärtstrend erwartet.
- Erreicht Aroon Up den Wert Null, wird eine Abschwächung des Marktes erwartet.
- Liegt Aroon Up zwischen 0 und 30, wird ein neuer Abwärtstrend erwartet.
- Ein starker Abwärtstrend ist zu beobachten, wenn der Aroon Up dauerhaft zwischen 0 und 30 liegt, während der Aroon Down dauerhaft zwischen 70 und 100 liegt.
- Parallele Bewegung von Aroon Up und Aroon Down:
- Wenn die Linien parallel und nahe beieinander verlaufen, kann mit einer weiteren Verstärkung des Trends gerechnet werden.
- Schnittpunkt der Linien:
- Wenn der Aroon Down den Aroon Up von unten nach oben kreuzt, wird eine Marktschwäche festgestellt und ein Preisrückgang ist zu erwarten.
- Wenn Aroon Up Aroon Down von unten nach oben kreuzt, ist mit einer potenziellen Marktstärkung und einem Preisanstieg zu rechnen.
Am zuverlässigsten ist das im D1-Intervall empfangene Signal im Vergleich zu beispielsweise dem H1-Intervall.
Eingaben
- Währung_Name - der Name des Finanzinstruments.
- Calc_Method - der Index des Indikators, auf dessen Grundlage der Aroon-Indikator berechnet wird:
- 0 - AD (Akkumulation und Verteilung des Volumens) - (standardmäßig).
- 1 - OBV (On Balance Volumen).
- 2 - Volumen (Tick-Volumen).
- 3 - AC (Accelerator/Decelerator).
- 4 - AO (Awesome Oscillator).
- 5 - BullsPower.
- 6 - BärenPower.
- 7 - BullsPower - BearsPower.
- 8 - Kraft (Kraft-Index).
- 9 - MFI (Geldfluss-Index).
- 10 - BW MFI (Market Facilitation Index).
- 11 - ATR (Average True Range).
- 12 - Momentum.
- 13 - RSI (Relative Strength Index).
- 14 - RVI (Relative Vigor Index).
- 15 - MA (Gleitender Durchschnitt)
- 16 - CCI (Commodity Channel Index).
- 17 - ADX (Average Directional Movement - Durchschnittliche Richtungsbewegung).
- 18 - DeMarker.
- 19 - Standardabweichung.
- 20 - OsMA (Oszillator der gleitenden Durchschnitte).
- 21 - MACD (Gleitender Durchschnitt Konvergenz Divergenz).
- 22 - Stochastik.
- 23 - %R (Williams % Oszillator).
- Ind_period - Berechnungszeitraum des Indikators.
- KPeriod - K-Periode der Stochastik.
- DPeriod - D-Periode der Stochastik.
- Verlangsamung - Verlangsamungsperiode der Stochastik.
- Stoch_Price - Art des Preises für die Stochastik:
- Low/High (standardmäßig).
- Schließen/Schließen.
- Price_Field - Mittelungsmethode für die Stochastik:
- Einfach.
- Exponential (standardmäßig).
- Geglättet.
- Linear gewichtet.
- FastPeriod - die schnelle MA-Periode des Basisindikators MACD oder OsMA.
- SlowPeriod - die langsame MA-Periode des Basisindikators MACD oder OsMA.
- SignalPeriod - die Periode der Signallinie des Basisindikators MACD oder OsMA.
- MA_Method - Mittelungsmethode für den MA des Basisindikators:
- Einfach.
- Exponential (standardmäßig).
- Geglättet.
- Linear gewichtet.
- Applied_Price - der verwendete Preis des Basisindikators:
- Schlusskurs (standardmäßig).
- Eröffnungskurs.
- Hoher Preis.
- Niedriger Preis.
- Mittlerer Preis.
- Typischer Preis.
- Gewichteter Preis.
- Modus - der Index der Linie (MAIN - 0 (standardmäßig) oder SIGNAL - 1) des Basisindikators, auf dessen Grundlage ADX, RVI, Stochastic oder MACD berechnet werden.
- Verschiebung - die Verschiebung des Basisindikators im Verhältnis zum Preisdiagramm.
Empfehlungen
Der Indikator kann zusammen mit dem Preisindikator Aroon verwendet werden.