Currency Sessions Highlight Ind
- Indicadores
- Versión: 1.1
- Actualizado: 22 marzo 2020
- Activaciones: 5
Contáctenos para cualquier pedido personalizado,CodeYourTrade.com.
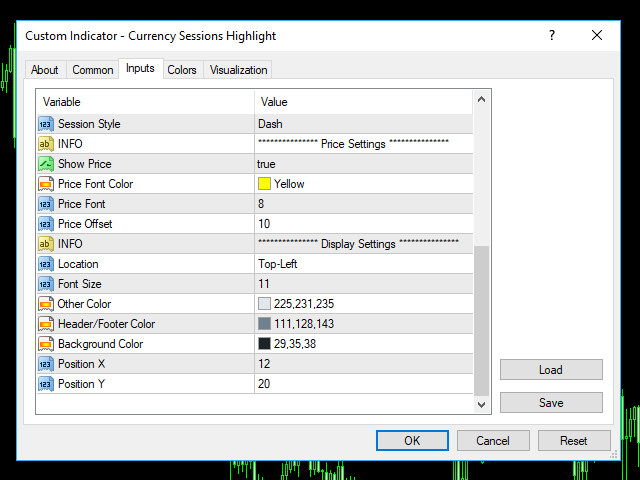
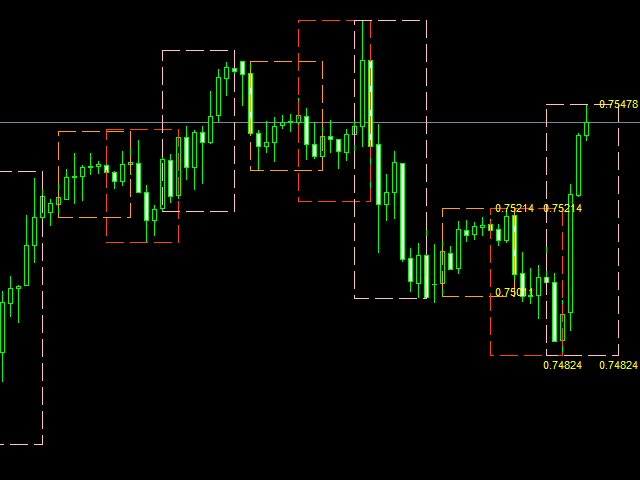
El indicador Currency Sessions Highlight se utiliza para resaltar las sesiones. El número máximo de sesiones visibles a la vez es 3. El usuario tiene que introducir la hora de inicio y fin de la sesión en el formato HH:MM.
Puede ocultar toda la información mostrada en el gráfico estableciendo false en Mostrar en gráfico.
Configuración del Indicador:
Configuración principal
- Mostrar Sesión 1: Dibuja o no la Sesión 1 en el gráfico
- Inicio Sesión 1: Hora de inicio de la sesión 1
- Session 1 End: Hora de finalización de la sesión 1
- Color Sesión 1: Color de la Sesión 1
- Mostrar Sesión 2: Dibuja o no la Sesión 2 en el gráfico
- Inicio Sesión 2: Hora de inicio de la sesión 2
- Session 2 End: Hora de finalización de la sesión 2
- Color Sesión 2: Color de la Sesión 2
- Mostrar Sesión 3: Dibuja o no la Sesión 3 en el gráfico
- Sesión 3 Inicio: Hora de inicio de la sesión 3
- Session 3 End: Hora de finalización de la sesión 3
- Color de la sesión 3: Color de la sesión 3
- Estilo de la sesión: Estilo de la línea rectangular de la sesión
- Sólido
- Guión
- Punto
- DashDot
- HashDotDot
Precio
- Mostrar precio: Mostrar el precio máximo/mínimo de la sesión
- Price Font Color: Color del precio
- Fuente del precio: Tamaño de letra del precio
- Desplazamiento del precio: Distancia del precio desde el máximo/mínimo