Channel Breakout Ind
- Indicadores
- Versión: 2.1
- Actualizado: 22 marzo 2020
- Activaciones: 5
Contacte con nosotros para cualquier orden personalizada,CodeYourTrade.com.
El indicador Channel Breakout muestra los canales basados en el número de barras. Se utiliza para negociar las rupturas o retrocesos.
¡¡¡Breakout es bastante eficiente, ya que trata de obtener beneficios cuando el mercado se desploma!!! También puede inventar su propia técnica a partir de él.
Después de conectar el indicador a un gráfico mostrará la siguiente información en el gráfico:
1. Información del canal 1 y canal 2
2. Información de alerta y correo electrónico
Puede ocultar toda la información mostrada en el gráfico configurando falso en Mostrar.
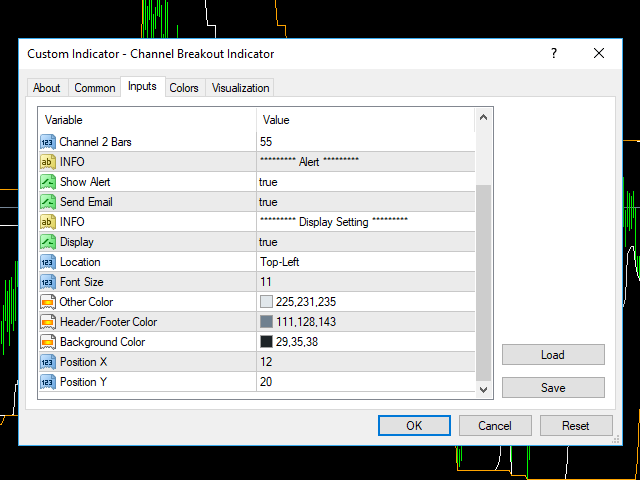
Configuración del indicador
Configuración principal
- Habilitar Canal 1: Si es verdadero, se muestra el canal 1
- Barras Canal 1: Número de barras utilizadas para encontrar el canal 1
- Habilitar Canal 2: Si es verdadero, se muestra el canal 2
- Barras del canal 2: Número de barras utilizadas para encontrar el canal 2
Alerta
- Mostrar Alerta : Muestra el cuadro de Alerta
- Enviar Email: Envía un correo electrónico
Configuración de pantalla
- Mostrar: Muestra la información del indicador en el gráfico
- Ubicación: Ubicación de la ventana de visualización
- Arriba-Izquierda: Muestra todos los detalles en la parte superior izquierda .
- Bottom-Left: Muestra todos los detalles en la parte inferior izquierda .
- Tamaño de letra: Tamaño de la fuente
- Otro color: Color general
- Color cabecera/pie: Color de la cabecera y pie de página de la ventana .
- Color de fondo: Color de fondo de la ventana de visualización
- Posición X: Posición en el eje X de la ventana de visualización
- Posición Y: Posición Y de la ventana de visualización