Vortex Trend Indicator
- Indicadores
- Versión: 1.1
- Actualizado: 24 marzo 2020

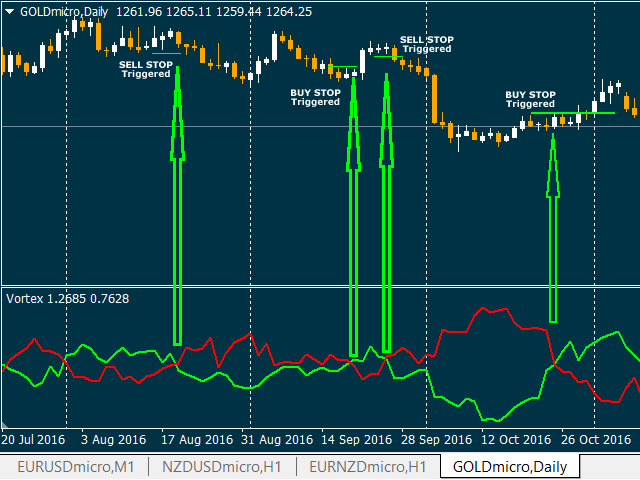
Desarrollado por Etienne Botes y Douglas Siepman, el indicador Vortex consta de dos osciladores que captan los movimientos de tendencia positivos y negativos. Para crear este indicador, Botes y Seipman se basaron en los trabajos de Welles Wilder y Viktor Schauberger, considerado el padre de la tecnología de implosión. A pesar de una fórmula bastante complicada, el indicador es bastante sencillo de entender y fácil de interpretar.
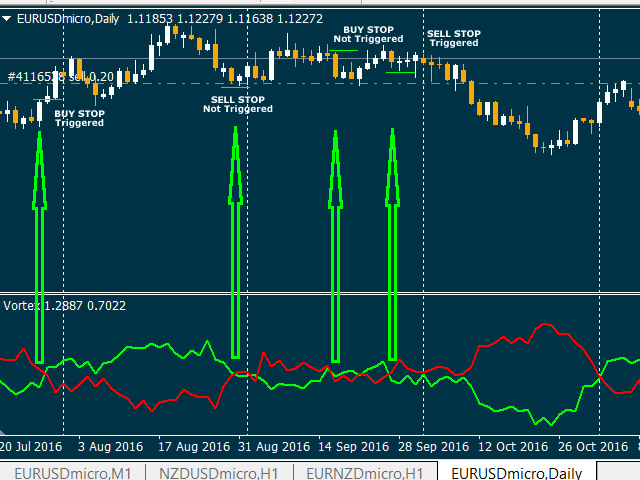
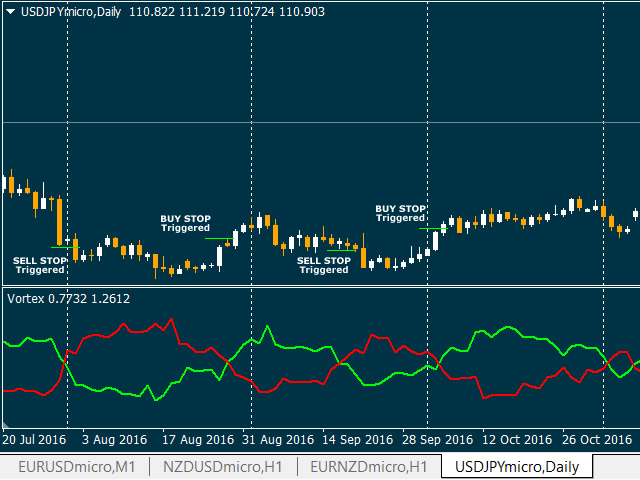
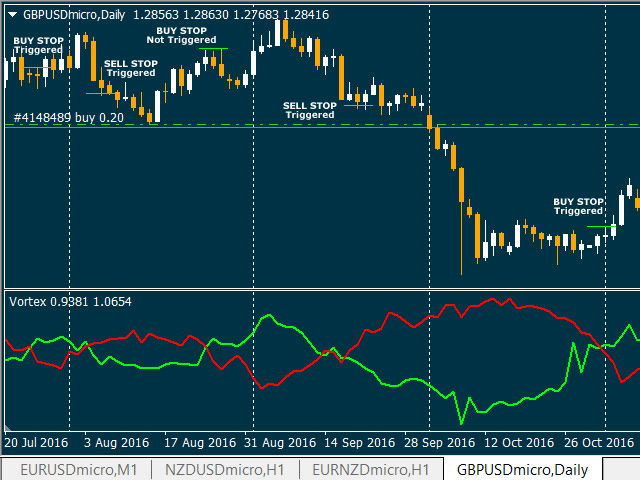
- Una señal alcista se activa cuando el indicador de tendencia positiva (VI+ línea verde) cruza al alza el indicador de tendencia negativa (VI- línea roja) o un nivel clave. Se recomienda abrir una orden de COMPRA STOP en el nivel alto de la barra.
- Una señal bajista se activa cuando el indicador de tendencia negativa (VI- línea roja) cruza hacia abajo el indicador de tendencia positiva (VI+ línea verde) o un nivel clave. Se recomienda abrir una orden SELL STOP en el nivel Low de la barra.
El indicador Vortex está por encima o por debajo de estos niveles, lo que significa que siempre tiene un claro sesgo alcista o bajista. Mejor rendimiento en H4 y D1 timeframes.
Parámetros
- periodo: por defecto es 14.
- VI_Plus: color para la línea de tendencia positiva (VI+).
- VI_Minus: color para la línea de tendencia negativa (VI-).


USING AT H1-H4 AFTER CHANGED THE PERIOD FROM 14 TO 28 , GOOD TOOL . THANK YOU